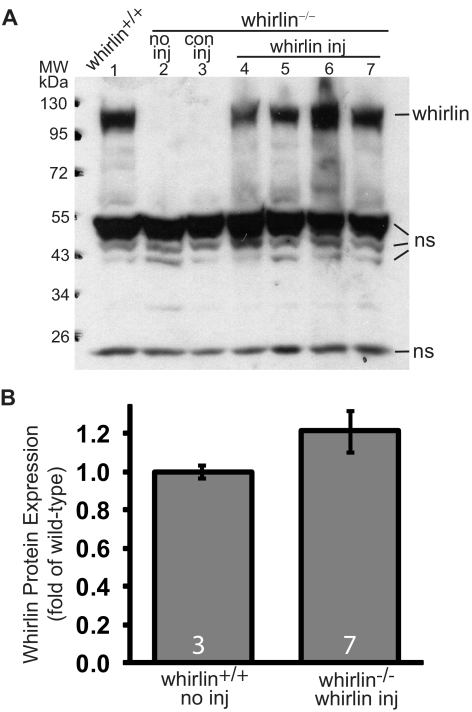
Figure 3.
Whirlin transgene expression in the injected whirlin−/− retina at 10 weeks post injection detected by Western blot analysis. (A) A representative whirlin Western blot from one wild-type mouse (whirlin+/+, lane 1) and six whirlin−/− mice with various treatments: no inj, no subretinal injection (lane 2); con inj, control subretinal injection of AAV-zsGreen (lane 3); whirlin inj, subretinal injection of AAV-whirlin (lanes 4–7, four different whirlin−/− mice). The whirlin band is at the position of approximately 110 kDa. Several non-specific bands (ns) at around 50 and 24 kDa are shown here as sample loading controls. (B) Quantification of whirlin signal intensities on the Western blot from wild-type retinas and whirlin−/− retinas injected with AAV-whirlin. There is no statistically significant difference between the two groups. The number of mice measured in each group is indicated at the bottom of the bars. The error bar represents the SEM.

