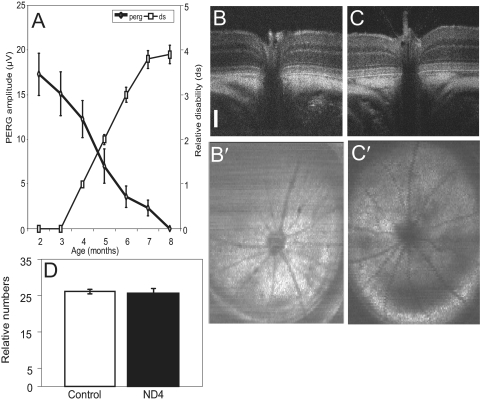
Figure 3.
Correlation between PERG and disability assessment and evaluation of optic nerve head using OCT. (A) Determination of correlation of PERG and disability in a representative ND4 mouse. Thick solid line with diamonds: PERG amplitude. Thin solid line with squares: disability measurement in Expanded Disability Status Scale. (B, C) Representative cross-sectional images of the retina and optic nerve of control (B, B′) and ND4 (C, C′) at 5 months of age using OCT. Scale bar, 100 μm. (D) Relative number of Brn3b-positive RGCs for an area of 0.01 mm2 and an equivalent region of retina from control and ND4 mice (at 5 months). Mean ± SEM using counts from 10 sections performed by two independent observers. Statistical t-test showed insignificant difference between the two groups.

