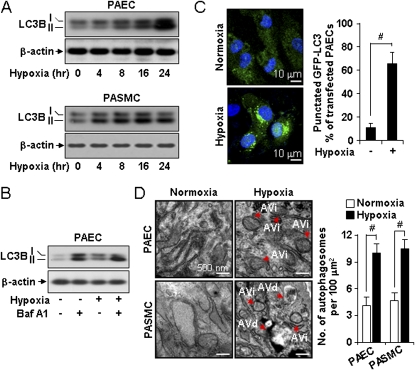
Figure 2.
Hypoxia increased the expression and activation of light chain-3B (LC3B) in pulmonary vascular cells in vitro. (A) pulmonary artery endothelial cells (PAEC) and pulmonary artery vascular smooth muscle cells (PASMC) were exposed to hypoxia for 0–24 hours and evaluated for expression of LC3B-I and LC3B-II by Western analysis. β-actin served as the standard. (B) PAEC were exposed to hypoxia for 24 hours in the absence or presence of bafilomycin A1 (100 nM), and evaluated for the expression of LC3B-I and LC3B-II by Western analysis. β-actin served as the standard. (C) PAEC transfected with green fluorescence protein–LC3 were exposed to hypoxia or normoxia for 24 hours. Cells were visualized by confocal microscopy and the percentage of cells exhibiting punctuated green fluorescence protein–LC3 fluorescence was calculated relative to all green fluorescence protein–positive cells. Data represent mean ± SD. #P < 0.01. (D) Electron microscopic analysis of PAEC and PASMC after 24 hours of hypoxia. Red arrows indicate the presence of immature (AVi) or degradative (AVd) autophagic vacuoles. AV were scored as described in reference (22). Scale bar = 500 nm. Graphs represent quantification of autophagosomes (AVi + AVd) per cell in PAEC and PASMC exposed to hypoxia or normoxia. Data represent mean ± SD. n = 15 electron microscope images per cell type and condition, #P < 0.01.

