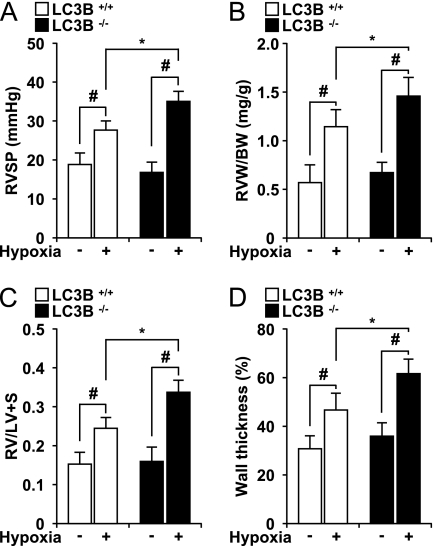
Figure 3.
Light chain-3B (LC3B−/−) mice display enhanced indices of pulmonary hypertension after chronic hypoxia. (A) Right ventricular systolic pressure (RVSP) was measured in LC3B+/+ (open square) and LC3B−/− (black square) mice after hypoxia (n = 15) and normoxia (n = 15) for 4 weeks. (B) Right ventricle weight (RVW) (milligrams) normalized for body weight (BW) (grams) in LC3B+/+ (open square) and LC3B−/− (black square) mice. (C) Fulton index of right ventricular hypertrophy (RVH), measured as ratio of the RVW to that of the left ventricle plus septum (RV/LV+S). (A–C) Data represent mean ± SD (n = 5). #P < 0.01; *P < 0.05. (D) Graphic shows quantitation of percent wall thickness of pulmonary arterioles in the lungs of LC3B+/+ (open square) and LC3B−/− (black square) mice after normoxia (n = 10 per group) and hypoxia (n = 10 per group). Data are expressed as mean ± SE (*P < 0.05; #P < 0.01) for hypoxic LC3B−/− mice versus hypoxic LC3B+/+ mice and corresponding normoxic controls.

