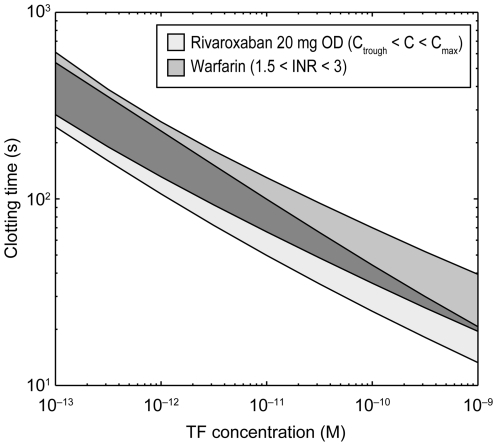
Figure 8. Simulation of thrombus inhibition with rivaroxaban and warfarin.
Rivaroxaban concentrations at 20 mg once daily: Cmax 251 ng/ml, Ctrough 30 ng/ml. The width of the rivaroxaban curve reflects the Ctrough to Cmax concentration range and the width of the warfarin curve reflects the typically used INR range. Cmax, maximum concentration; Ctrough, minimum concentration; INR, international normalized ratio; OD, once daily; TF, tissue factor.

