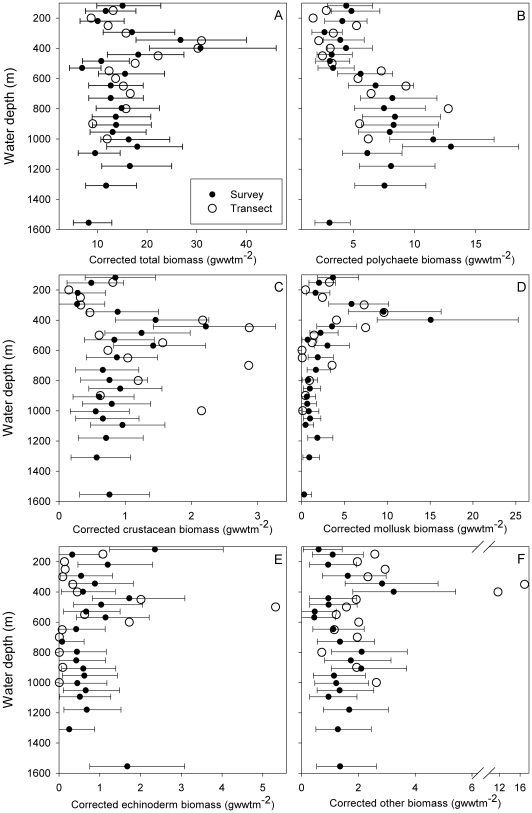
Figure 3. Variation in corrected biomass (>0.5 mm) with depth.
(A) Total biomass. (B) Polychaete biomass. (C) Crustacean biomass. (D) Mollusk biomass. (E) Echinoderm biomass. (F) Other taxa biomass. Solid circles indicate the wide-area survey depth bands (geometric mean and 95% confidence interval), open circles indicate the depth transect stations (geometric mean).

