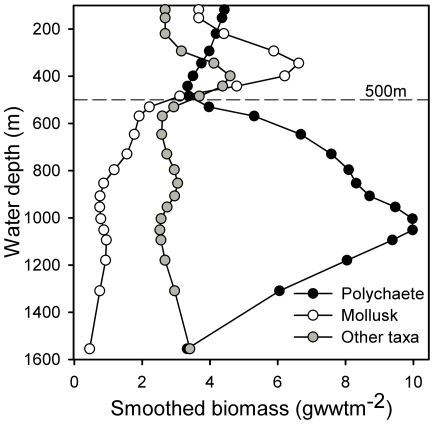
Figure 4. Summary of depth-related patterns in macrofaunal biomass distribution with depth.
Wide-area survey geometric mean biomass (>0.5 mm, corrected) of selected major taxa, shown after depth-ordered smoothing (4253H, twice method; see e.g. Velleman [53]).

