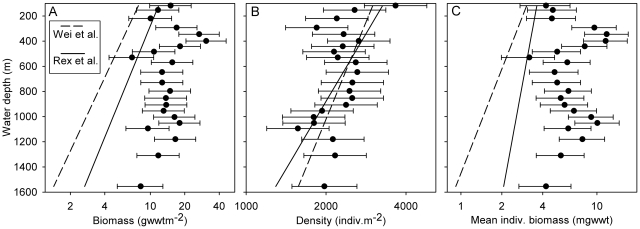
Figure 6. Variation in corrected macrofaunal biomass, density and mean individual biomass (>0.5 mm) with depth.
(A) Biomass. (B) Density. (C) Mean individual biomass. Geometric mean and 95% confidence interval are shown for each parameter (wide-area survey data). Vertical lines are the global regressions of these parameters on depth established by Rex et al. [9] and Wei et al. [20].

