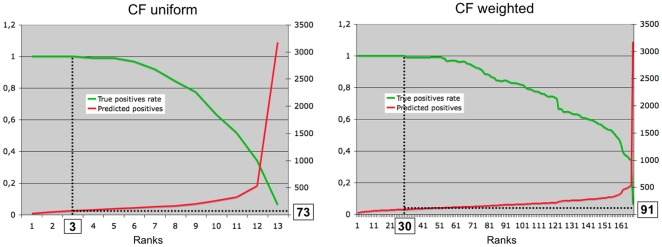
Figure 3. True positive rate for uniform and weighted collaborative filtering.
The true positive rate (green) and the total number of positives are plotted for uniform (left) and weighted (right) collaborative filtering, as a function of the category. The vertical and horizontal dotted lines give the category, and the corresponding number of conformations predicted as positives, above which the true positive rate decreases under 1.

