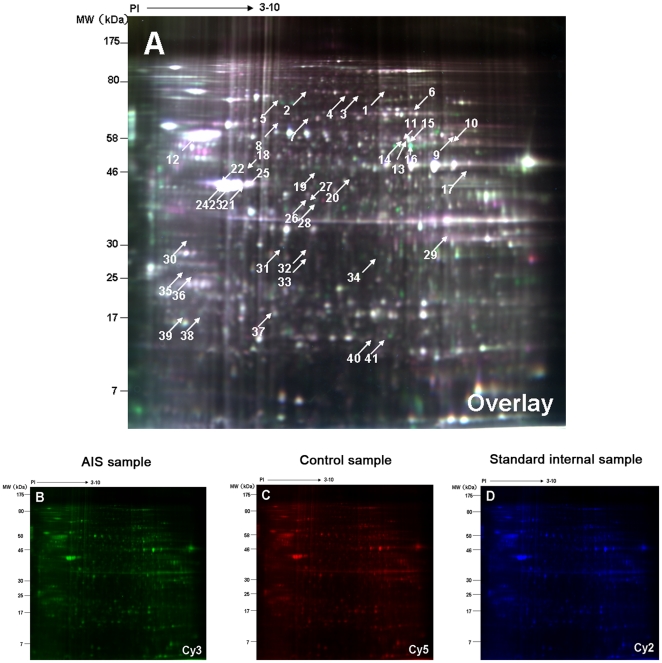
Figure 3. Identification of the differentially expressed proteins using 2-DE.
The figure displays Representative 2D-DIGE images of MSCs labeled with Cy3(B) , Cy5(C),Cy2(D) and overlay of the three color images(A) derived from a single gel. Spots for which the quantitative statistical analysis revealed >1.3-fold protein expression change and a Student's t test p value less than 0.05 in the AIS group were annotated by numbers according to pI and Mw. The annotated protein spots were cut out of the gel and subjected to tryptic digestion followed by MS analysis.

