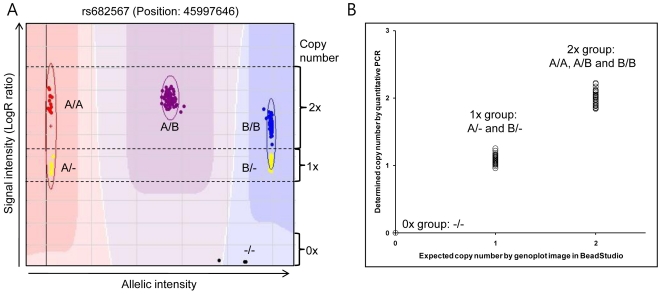
Figure 1. Copy number variation validation by qPCR around rs682567 within chr15:45994758–45999227.
(A) Genoplot image of the identified deletions (marker name: rs682567). Genoplot image represents allelic intensity (X-axis) and signal intensity (Y-axis) of all samples. Two types of copy numbers are depicted as 2× and 1×. Individuals having hemizygous deletions (copy number: 1×) are clustered as two distinct groups (color: yellow). Samples having null copy numbers are displayed with a black dot at the bottom. (B) Validation by qPCR around the rs682567 within chr15: 45994758–45999227. The value of the X-axis (expected copy number) is estimated by the Illumina Genoplot image analysis. The Y-axis indicates the determined copy number by qPCR. The copy number value estimated through visual examination is matched with the quantitative measurement value by qPCR.

