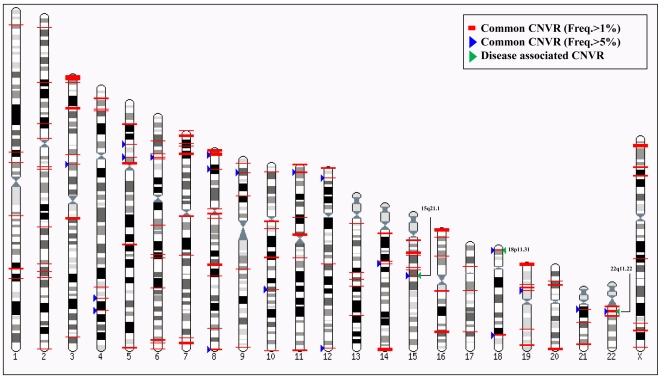
Figure 2. Map of identified common copy number variation and T2DM-associated regions.
This figure shows common CNVRs (freq.>1%, red-colored rectangle) and highly common CNVRs (freq.>5%, blue colored triangle) from CNVs identified in this study. Putative diseases associated CNVRs are marked by a green-colored triangle. The location of each CNVR was displayed by the Karyoview of Ensembl (http://apr2006.archive.ensembl.org/Homo_sapiens/karyoview) according to our previous method [41].

