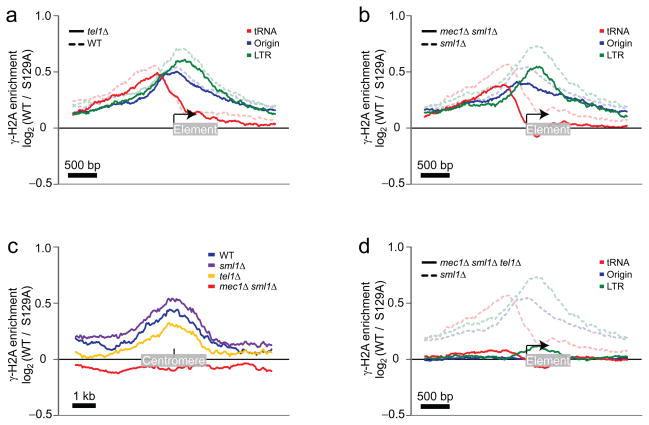
Figure 3.
Mapping of the γ-H2A enrichment in cells harboring different combinations of TEL1, MEC1 and SML1 deletions on natural replication fork barriers. (a) Enrichment of γ-H2A from WT cells (blue curves from Figure 1b-d) are grouped on the same graph (tRNA genes in red, DNA replication origins in blue, and LTRs in green) and presented in dashed transparent curves while the γ-H2A enrichment detected in the tel1Δ cells is shown in solid curves. (b) As in a except that solid curves were obtained from mec1Δ sml1Δ cells while dashed curves represent sml1Δ control cells. (c) The γ-H2A enrichment was mapped in the middle of the 16 centromeres in WT (blue), sml1Δ (purple), tel1Δ (gold) and mec1Δ sml1Δ (red) cells. (d) As in b except that solid curves were obtained from the mec1Δ sml1Δ tel1Δ cells.

