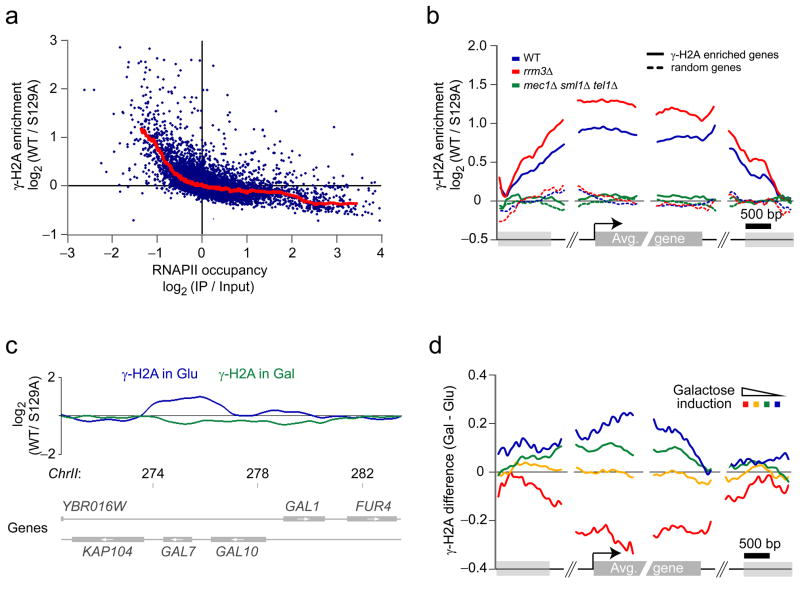
Figure 5.
Many inactive genes display γ-H2A enrichment. (a) Anti-correlation between γ-H2A and RNAPII occupancy for the least transcribed genes. The average γ-H2A enrichment is plotted against RNAPII occupancy as determined by ChIP-chip in the same conditions. (b) γ-H2A accumulation at inactive genes is enhanced in rrm3Δ cells and is abolished in mec1Δ sml1Δ tel1Δ cells. The average γ-H2A enrichment ratios for WT (blue), rrm3Δ (red) and mec1Δ sml1Δ tel1Δ (green) cells are mapped relative to the 5′ and 3′ boundaries of protein-coding genes enriched for γ-H2A (solid curves) and on a random group containing the same number of genes (dashed curves). (c) Gene activation abolishes the accumulation of γ-H2A at repressed protein-coding genes. The smoothed γ-H2A enrichment ratios for cells grown in presence of glucose (blue) and galactose (green) are shown at the GAL7-10-1 locus. Chromosomal positions are indicated in kilobases. (d) The variation of γ-H2A level is correlated with galactose induction. The difference of γ-H2A enrichment ratios between cells grown in the presence of galactose (Gal) or glucose (Glu) is mapped (as in b) on groups of genes based on their fold change of expression in the presence of galactose27.

