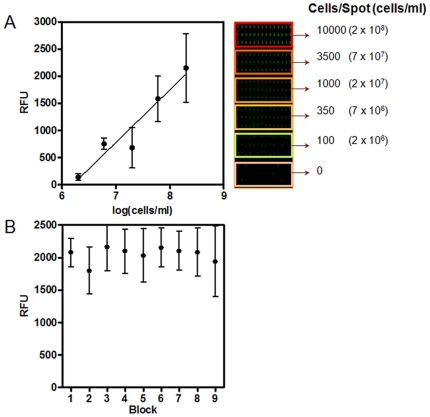
Figure 4. Validation of the fungal biofilm chip for high-throughput analyses.
(A) Correlation of fluorescence intensities of spots obtained after FUN 1 staining with the number of viable cells present in each spot. The fluorescence intensities were measured using a microarray scanner and the values are expressed as RFUs. (B) Fluorescence intensity of nano-biofilms on CaBChip stained with FUN 1. Values represent mean and standard deviations of multiple independent biofilms formed in each of 9 different blocks of the chip.

