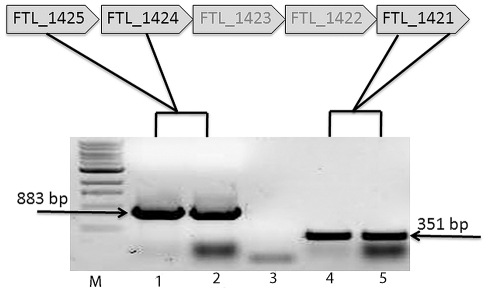
Figure 6. RT-PCR of the DNA region FTL_1421 from LVSΔ1423/1422.
LVS and LVSΔ1423/1422 were grown on Glc-CDMA for at least 2 days, the RNA isolated, converted to cDNA, and amplified by PCR to determine if a transcript from DNA downstream of the mutation was made. Lanes: M, 1 kb+ DNA molecular size standards; 1, control amplification of FTL_1425-1424 in LVS; 2, amplification of FTL_1425-1424 upstream of the mutation in LVSΔ1423-1422; 3, control amplification of FTL_1425-1424 upstream of the mutation (no bacteria); 4, control amplification of FTL_1421 from LVS; 5, amplification of FTL_1421 immediately downstream of the mutation in LVSΔ1423/1422. The presence of a normal band of about 351 bp from LVSΔ1423/1422 indicated that the mutation had no polar effect on downstream genes.

