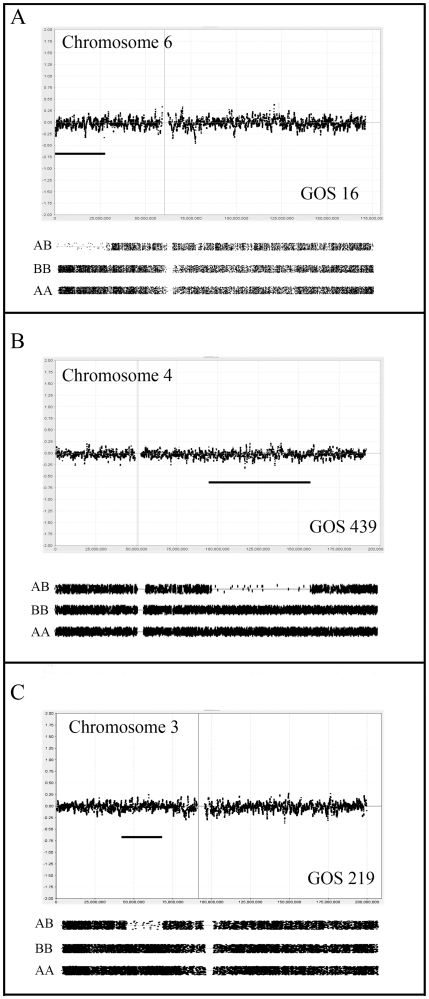
Figure 1. aCGH analysis of copy number neutral LOH events in WT.
Upper panels in each case show copy number status for each of the identified tumors (GOS 16, 439, 219) on a Log2 scale (0 = no change). The lower panel for each chromosome shows LOH status (see Materials and Methods) coinciding with significant reduction in AB genotypes compared to homozygous AA and BB genotypes. These LOH regions are highlighted by the horizontal bar in the copy number profile. In A-C all LOH events are accompanied by CNN aCGH profiles.

