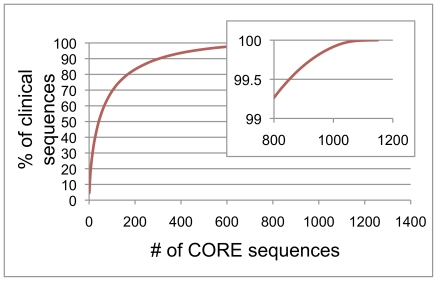
Figure 2. Cumulative distribution of clinical sequences against database entries.
The frequency with which each of the sequences in CORE were encountered in the clinical datasets used for curation are shown as the cumulative percent of total sequences. They are ordered from most to least common. The majority of clinical sequences were accounted for by fewer than 1000 CORE entries.

