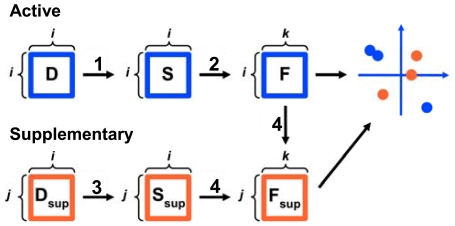
Figure 1. Schematic representation of the MDS analysis.
The analysis of N active and N sup supplementary sequences are represented in blue and orange, respectively. D and Dsup represent distance matrices, S and Ssup cross-product matrices and F and Fsup factor score matrices. The coordinate of the i th active sequence on the k th principal component is directly obtained from the i th element of the k th column of F. The coordinate of the j th supplementary sequence on the k th principal component of the active space is directly obtained from the j th element of the k th column of Fsup. The numbers above the arrows refer to the equations given in the Methods section.

