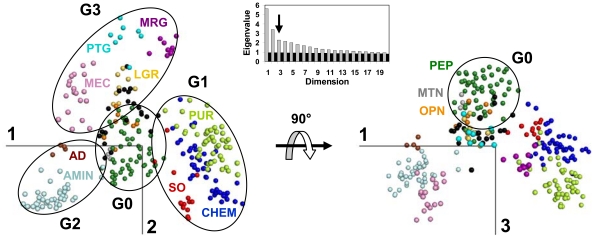
Figure 2. MDS representation of human non-olfactory class A GPCRs.
Data are projected onto the planes defined by the first and the second components (left) and by the first and the third components (right). The insert displays the scree plot of the first twenty eigenvalues obtained from the MDS analysis of human GPCRs (grey bars) and, for comparison, the eigenvalues obtained from a random MSA with the same characteristics as human GPCRs (black bars). The color code refers to the GPCR sub-families (AD: brown; AMIN: light blue; CHEM: dark blue; LGR: yellow; MEC: pink; MTN: grey; MRG: violet; OPN: orange; PEP: dark green; PTG: cyan; PUR: light green; SO: red; UC: black).

