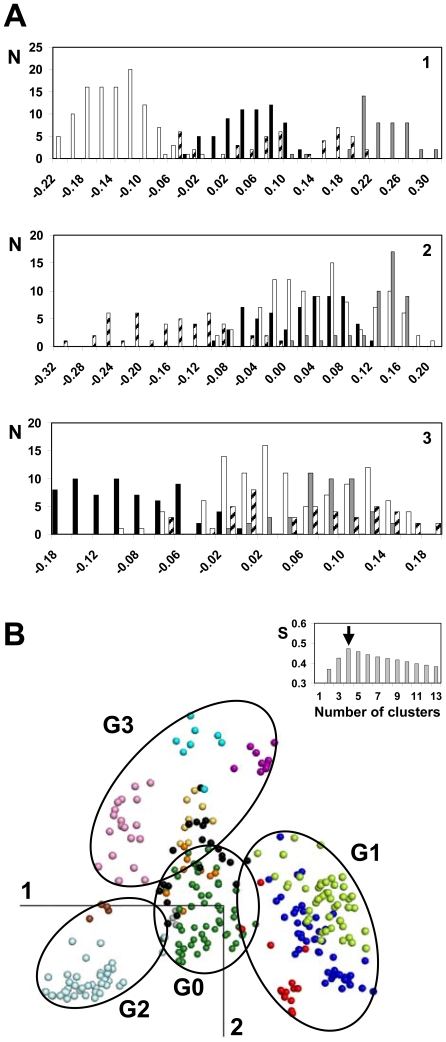
Figure 3. Clustering of human GPCRs.
In (A), the histograms show the distribution of the receptors from groups G0 (black bars), G1 (white bars), G2 (grey bars) and G3 (hatched bars) as a function of their coordinates on the first, second and third components (from top to bottom). In (B), the four clusters obtained by K-means analysis are visualized by spanning ellipses onto the plane formed by the first two components. The insert displays the Silhouette score S obtained for K-means clustering as a function of the number of clusters. The color code refers to the GPCR sub-families (AD: brown; AMIN: light blue; CHEM: dark blue; LGR: yellow; MEC: pink; MTN: grey; MRG: violet; OPN: orange; PEP: dark green; PTG: cyan; PUR: light green; SO: red; UC: black).

