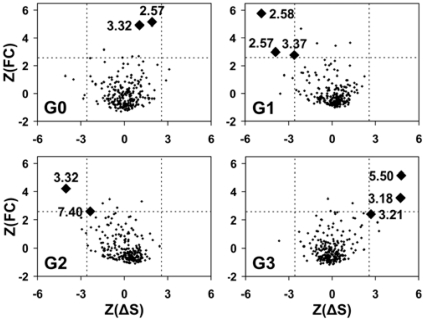
Figure 7. Sequence analysis of the four MDS groups.
For each group Gi (i = 0 to 3) and each position l of the alignment, the Z-score of the correlation function, FC(l), is plotted as a function of the Z-score of the entropy difference ΔS(l) between group Gi and its complement GiC. The dashed lines correspond to Z-scores of 2.58 (99% confidence level).

