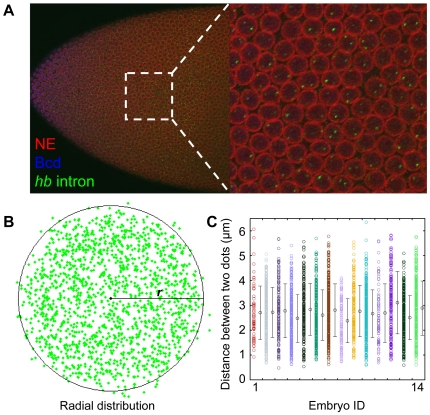
Figure 1. Simultaneous detection of Bcd and nascent hb transcripts in embryos.
(A) Shown is a merged Confocal image of a wt embryo at early nuclear cycle 14 detecting the nuclear envelope (red), Bcd protein (blue) and the nascent hb transcripts as intron dots (green). Shown on the right is a magnified view of a section of the expression region. (B) Shown is the radial distribution of detected hb intron dots. Data shown here were extracted from one single wt embryo with 2,556 identified nuclei (with a mean diameter l = 6.06±0.80 µm) and 1,537 detected intron dots. Intron dots that appear to be outside the boundaries of this illustrative “average” nucleus are due to the fact that real nuclei are not all perfectly round in shape. As explained in the text, our intron dot dataset used in all the analyses described in this work were extracted from within the nuclei. (C) Shown are the measured distances between two detected hb intron dots inside individual nuclei. The measured mean distance between two intron dots inside individual nuclei is 2.70±0.18 µm for all 14 tested embryos (represented by different colors). Each error bar is one standard deviation among the nuclei for a single embryo.

