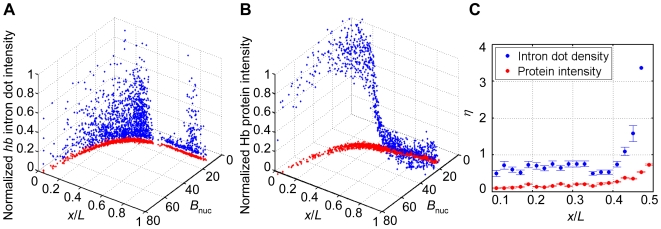
Figure 2. Expression profiles for hb intron dots and Hb proteins.
(A) Shown is a 3-D scatter plot of normalized A-P positions (x/L), mean Bcd intensities of the nucleus (B nuc) and the normalized intensities of hb intronic mRNA within identified dots for a single embryo. The projection onto the x/L-B nuc plane (red) gives the profile of the nuclear Bcd intensity as a function of the A-P position. (B) Shown is a 3-D scatter plot of normalized A-P positions (x/L), mean Bcd intensities of the nucleus (B nuc) and the normalized intensities of nuclear Hb protein for a single embryo. The projection onto the x/L-B nuc plane (red) gives the profile of the nuclear Bcd intensity as a function of the A-P position. (C) Shown are the noise (η) profiles of hb intron dot density (ρ) for a single embryo (blue) and the noise for Hb protein intensity for a single embryo (red) as a function of x/L. Error bars were obtained from bootstrapping.

