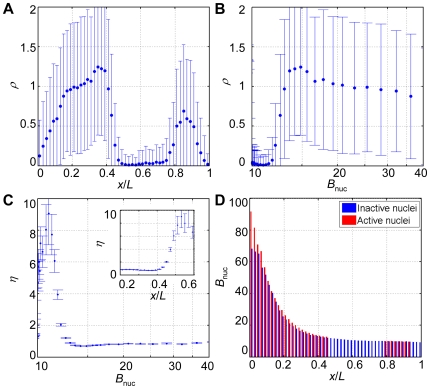
Figure 3. Investigating the role of Bcd in hb transcriptional events on embryonic and nuclear scales.
(A) Shown is the number density of hb intron dots (ρ) as a function of the A-P position (x/L). An error bar is one standard deviation. (B) Shown is the profile of ρ as a function of mean B nuc (on a log scale) of different bins along the A-P axis. An error bar is one standard deviation. (C) Shown is the measured noise η as a function of either mean B nuc (on a log scale) of different bins or the bin position x/L (inset). Error bars were obtained from bootstrapping. (D) Shown are the mean Bcd intensities within the inactive nuclei (blue) and the active nuclei (red) at different A-P positions. For the anterior hb expression region (x/L = 0.16∼0.46), where hb expression is dependent on Bcd concentration, p-values<0.0001 (Student's t-tests); at the posterior of the embryos (x/L = 0.82∼0.96), where a Bcd-independent hb expression domain is detected, p-values>0.1; for the non-expressing regions of the embryos (x/L = 0.46∼0.82 and 0.96∼1), where the burst probability is too low (<0.05) to allow reliable computation of the mean Bcd intensities within the active nuclei, only B nuc within inactive nuclei are shown.

