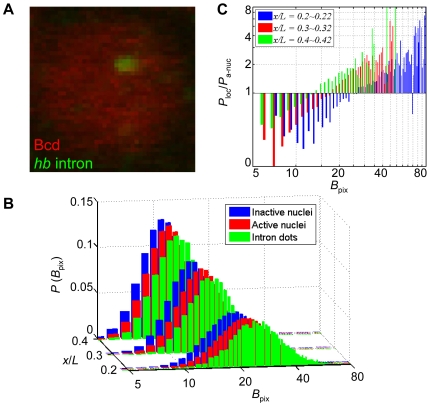
Figure 4. Investigating the role of Bcd in hb transcriptional events on the local scale.
(A) A zoom-in merged view of a nucleus showing a single detected hb intron dot (green) and Bcd intensities (red). (B) Shown are the probability density functions of Bcd pixel intensity, P(B pix), inside the inactive nuclei (blue), the active nuclei (red), or the areas of the detected intron dot sites (green). Data from three different A-P positions are shown in different colors. (C) Ratio of P(B pix) inside the areas of the detected intron dot sites to P(B pix) within the active nuclei. A base line at ratio of 1 is drawn (see text for details). Different colors represent data at different A-P positions: x/L = 0.2∼0.22 (blue), x/L = 0.3∼0.32 (red) and x/L = 0.4∼0.42 (green).

