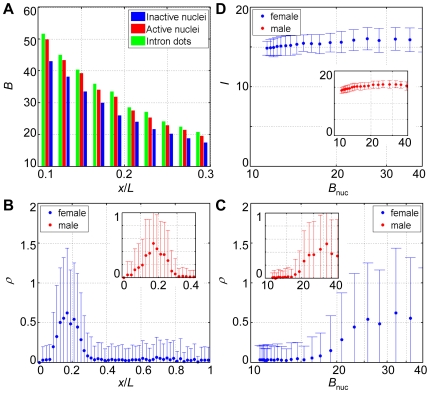
Figure 5. Multiscale investigation of the transcriptional properties of otd.
(A) Shown are the mean Bcd intensities measured from the inactive nuclei (blue), the active nuclei (red) and the areas of the detected otd intron dots (green) as a function of x/L. Data were extracted from all 12 tested embryos (females and males). Student's t-tests were conducted to determine p-values for each A-P bin of nuclei. Comparing red with blue, all p-values<0.0001; comparing red with green, p-values are (in A-P order at the locations shown): 0.2, 0.1, 0.1, 0.01, 0.02, 0.06, 0.001, 0.02, 0.07 and 0.08. (B) Shown is the number density of otd intron dots (ρ) as a function of x/L for 8 female embryos (blue) or 4 male embryos (red, inset). An error bar is one standard deviation. (C) Shown is the number density of otd intron dots (ρ) as a function of mean B nuc of different bins along the A-P axis for 8 female embryos (blue) or 4 male embryos (red, inset). An error bar is one standard deviation. Hill coefficient for the posterior boundary in response to the Bcd input is 4.0±1.9, corresponding to fewer binding sites for Bcd molecules in the otd enhancer than those in the hb enhancer [55]. (D) Shown is the raw intensity of otd intron dots (I) as a function of mean B nuc of different bins along the A-P axis for 8 female embryos (blue) or 4 male embryos (red, inset). An error bar is one standard deviation.

