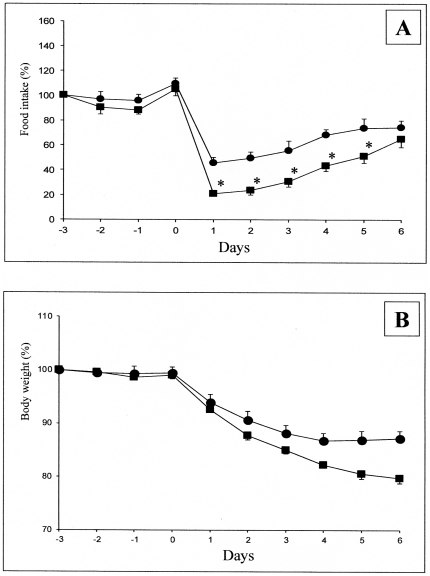
Figure 4. Effect of PED on food intake and body weight in SV129 and NPY/AgRP-neurons depleted mice.
Food intake (A) and body weight (B) were measured in AgRPDTR naive mice (circles) and in AgRPDTR mice treated as pups (squares). Mice were fed from “day 0” on the PED diet. For each point determination, n = 6 mice were studied. At day 6, because AgRPDTR treated mice still lost weight, PED feeding was stopped and mice were switched back on the control chow diet (SED). Body weight variation (B) is expressed in % of initial body weight and food intake (A) as % of reference food intake, as described in the legend of Fig. 1. All data from day 1 are different from day 0 (Student's t test for paired data) in panel A. *, different from wild-type mice (Student's t test for unpaired data).

