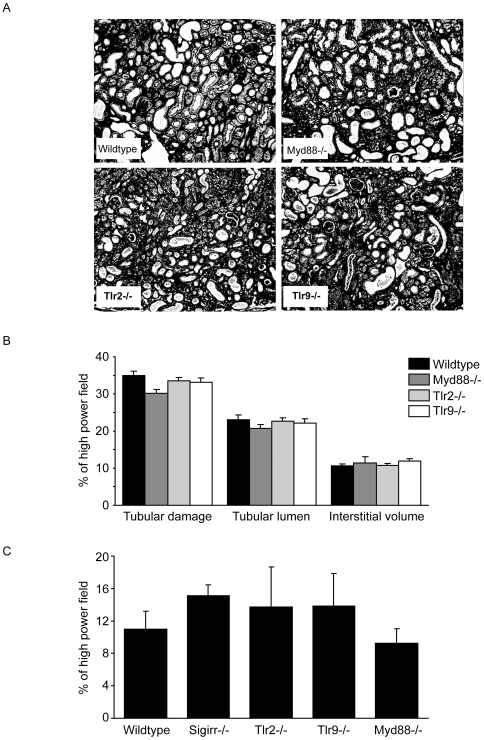
Figure 7. TLRs and morphometric analysis of tissue remodeling after UUO.
A: Cortical renal sections were stained with silver. Images illustrate representative sections of UUO kidneys 10 days after UUO in mice of the respective group as indicated (original magnification 200×). B: The indices for tubular cell damage, tubular dilatation, interstitial volume were determined by quantitative morphometry in obstructed kidneys at 10 days as described in methods. C: Interstitial fibrosis was quantified by digital morphometry on Masson Trichrom-stained sections as percentage of entire high power field. Values represent means ± SD from 10–15 high power fields.

