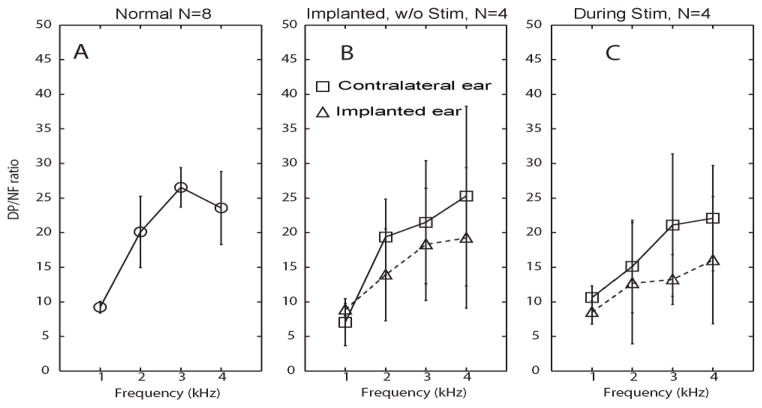
Figure 5. Distortion product vs. noise floor [DP/NF] ratios.
(A) DP/NF ratio [mean±SD] in response to clicks and pure tone pips at 1, 2 and 4 Hz, measured from eight normal ears in four rhesus monkeys. (B) DP/NF ratio measured from implanted ears (triangles) and contralateral ears (squares) 4 weeks after surgery in four monkeys, prior to prosthesis activation. (C) DP/NF ratio measured during prosthetic vestibular stimulation of the implanted ear (modulating over the range 48–222 pps). In panels B and C, triangles represent left (implanted) ear and squares represent right (control) ear.

