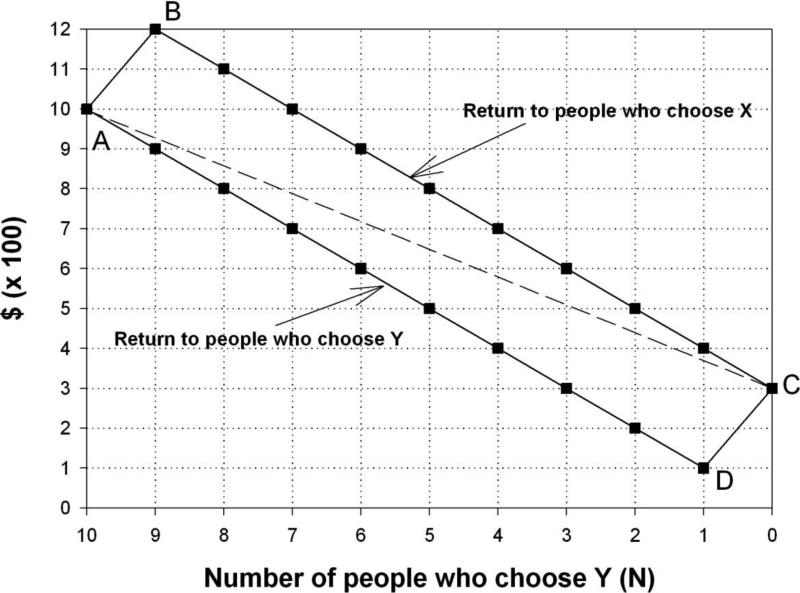
Figure 1.
Diagram of multi-person prisoner's dilemma game (lecture game). Lines A-D and B-C show returns to players who choose Y (cooperate) or choose X (defect) as a function of the decreasing number of players (out of 10) who choose Y (note reversed x-axis). The dashed line shows average earnings across the 10 players.

