
Figure 2.
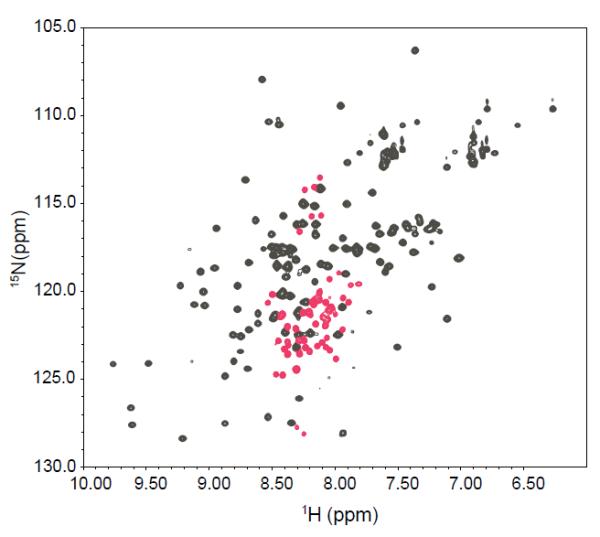
1H-15N HSQC spectrum of 15N-labeled P protein in 5 mM sulfate, pH 5.0 at 25°C. The peaks in grey are the folded state spectrum resonances assigned in a previous study (58). The peaks in red are extra peaks that appear under these buffer conditions. All of the extra peaks are located between 7.9 and 8.5 ppm in the 1H dimension. The labels give the assignments of the extra peaks.