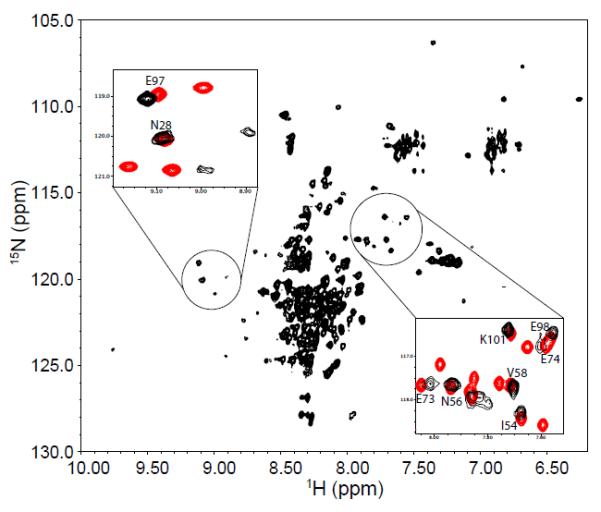
Figure 3.

1H-15N HSQC spectrum of 15N-labeled P protein in 20 mM sodium cacodylate, pH 5.0, at 25°C. Sulfate is not present in the sample, so P protein is predominantly unfolded. The peaks in the spectrum are poorly dispersed compared to those of folded P protein spectrum in Figure 1. The peaks in the two circles form patterns similar to those found in the folded P protein spectrum. The intensities of these peaks are weaker than those of the remaining unassigned resonances from unfolded P protein. The two insets show the overlapped HSQC spectra of unfolded (black) and folded P protein (red) in the circled regions. Labeled peaks are previously assigned residues for folded P protein.
