
Figure 4.
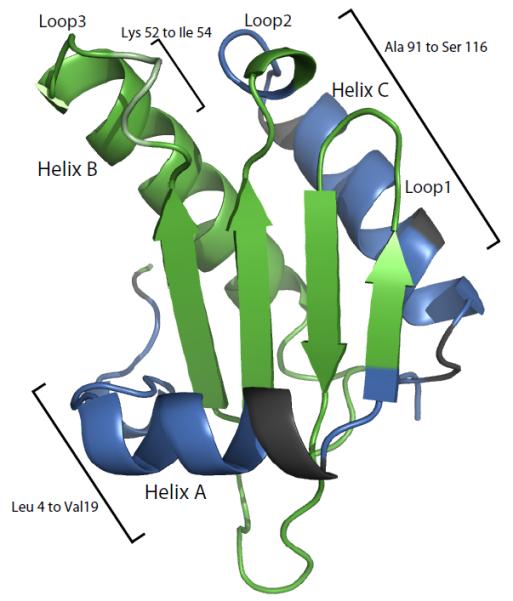
Mapping of the residues assigned to extra HSQC resonances on the crystal structure of folded P protein. The residues colored in blue are the extra peaks that are assigned in the study. The residues in dark grey are the residues that might have to the extra peaks but could not be unambiguously assigned. The remaining residues in green have a single resonance in the spectrum.