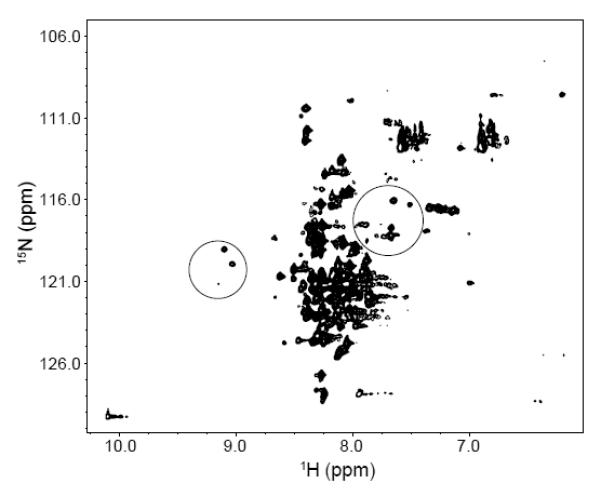
Figure 6.

1H-15N HSQC spectrum of 15N-labeled F107W variant of P protein in 20 mM sodium cacodylate, pH 6.0, at 25°C. The peaks in the spectrum are as poorly dispersed as those of unfolded WT P protein shown in Figure 3. The peaks in the two circles are assigned folded state P protein residues also present in the unfolded P protein spectrum. The intensities of these peaks are weaker than those of the remaining unassigned peaks of unfolded P protein.
