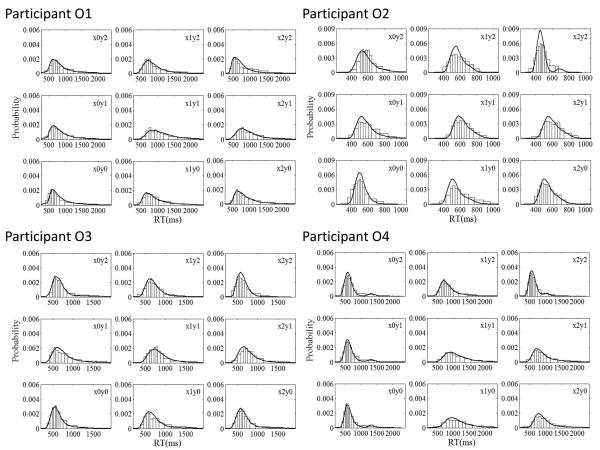
Figure 10.
Experiment 2: Fit (smooth curves) of the mixed serial/parallel model to the detailed response time (RT) distribution data (open bars) of the individual subjects. Each cell of each panel shows the RT distribution associated with an individual stimulus. Within each panel, the spatial layout of the stimuli is the same as in Figure 1. See text for further description of the derivation of the predicted and observed RT-distribution plots.

