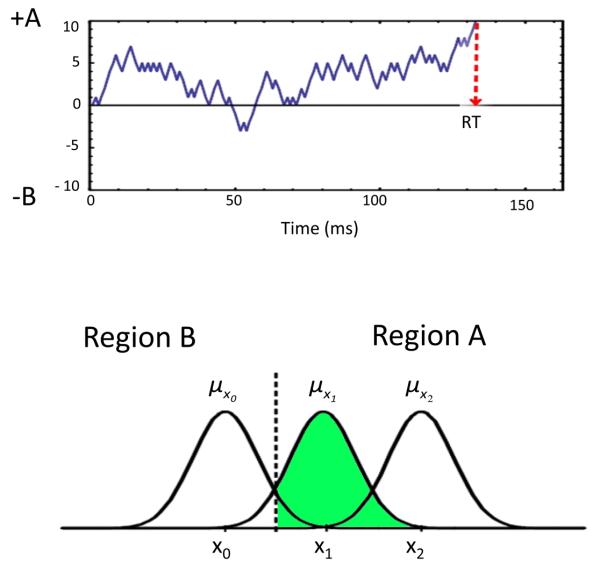
Figure 2.
Schematic illustration of the random-walk process that governs decision-making on each individual dimension. In the illustration, x1 is the presented stimulus value. Percepts sampled from distribution x1 that fall to the right side of the decision boundary lead the random walk on dimension x to take steps towards criterion +A.

