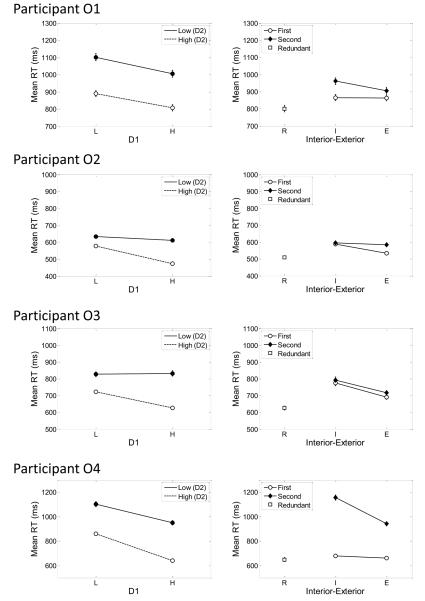
Figure 9.
Experiment 2: Observed mean response times (RTs) for the individual subjects and stimuli. Error bars represent ±1 SE. The left panels show the results for the target-category stimuli, and the right panels show the results for the contrast-category stimuli. Left panels: L = low-discriminability dimension value; H = high-discriminability dimension value; D1 = Dimension 1; D2 = Dimension 2. Right panels: R = redundant stimulus; I = interior stimulus; E = exterior stimulus. For ease in making comparisons to the prediction graphs in Figure 3, the contrast-category stimuli are labeled with respect to whether they are on the “first-processed” or “second-processed” dimension, as defined in the text.

