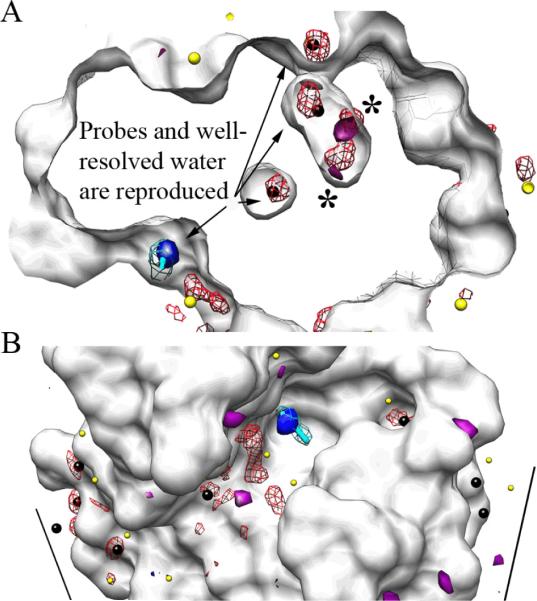
Figure 2.
MixMD data for the fully flexible simulation agrees well with densities from MSCS experiments using CCN and water. All snapshots were superimposed on the crystal structure of HEWL (white surface). MixMD density for water is shown in red mesh, and crystallographic waters are colored black for B-factors below 33 Å and yellow above 33 Å. The MSCS coordinates for CCN are shown in stick form (cyan with its electron density in mesh, 2Fo-Fc shown at 1.5σ); the highest occupancy for CCN in the fully flexible simulation matches perfectly and is shown in solid blue surface. Unsatisfied electron density in the crystal structure (positive Fo-Fc shown at 3σ) is shown in solid purple. (A) Water maps within the protein highlight interior waters conserved in the crystal structure and reproduced in our simulation. The large astrices (*) denote two highly occupied regions of the interior water map that correspond to unfulfilled density in the crystal structure. (B) Maps of the protein surface show good correspondence between crystallographic and MixMD densities for both CCN and well resolved waters. For the 16 crystallographic waters with B-factors below 33 Å (black spheres) five occur at symmetry-packing interfaces. MixMD misses four of the five which is expected because the contacts are not present in our simulation. The other 11 best resolved waters are well reproduced.

