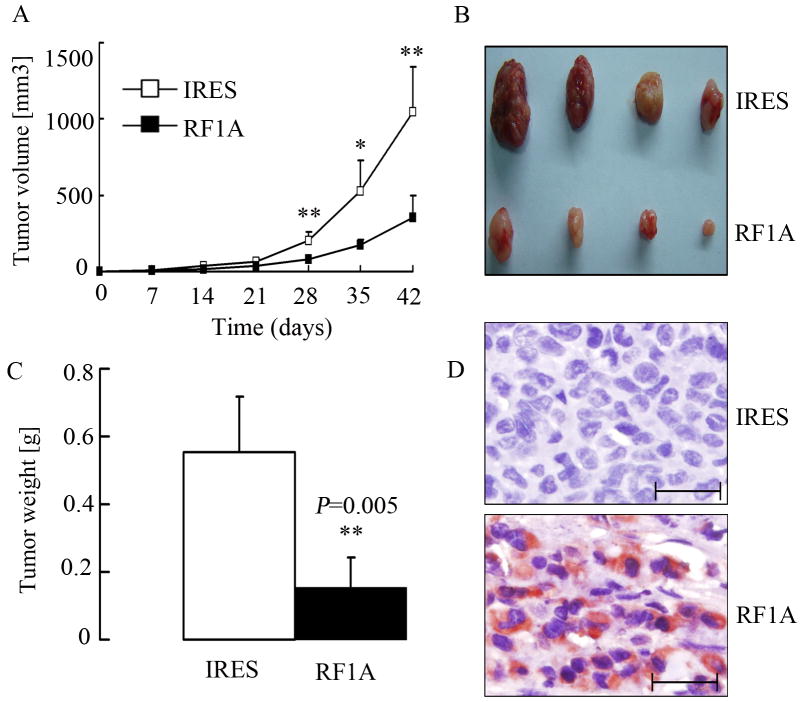
Figure 5. Exogenous expression of RASSF1A suppresses in vivo tumorigenesis.
(A). Tumor growth curve. Control (IRES) and RASSF1A (RF1A) cells were injected s.c. into BALB/c nude mice (N=4/group), and tumors were monitored every 7 days with the volume calculated. * P<0.05, ** P<0.01, as compared to tumors from control cells. (B). Photograph of tumors after isolation. (C). The wet weight of tumors was measured after excision. * P<0.01, as compared to tumors from control cells. (D). Tumors were subjected to immunohistochemistry assays for the expression of RASSF1A protein, which showed strong positive staining (red) in tumors from RASSF1A cells. Scale bar, 50 μm.

