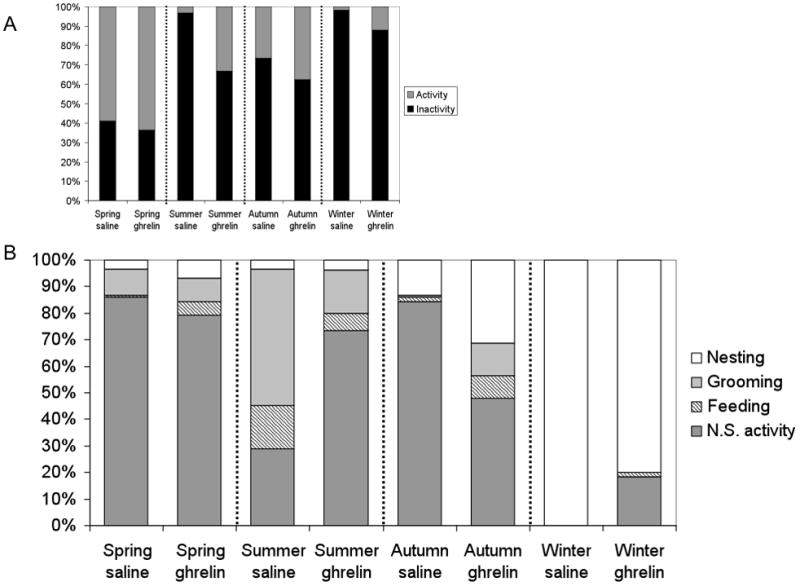
Fig. 6.

Ghrelin injection increased mean total activity compared with saline-injected controls in spring, summer, autumn, and winter. (A) Percent of 2 hrs after saline or ghrelin injections spent active (grey bars) or inactive (black bars) by season. (B) Percent of time spent performing specific behaviors (e.g. non-specific activity, feeding, grooming, and nesting) during total time active for each season after saline or ghrelin injections by season (=time (seconds) spent in specific behavior/total time active (seconds)*100). Drinking was omitted due to extremely small percentages.
