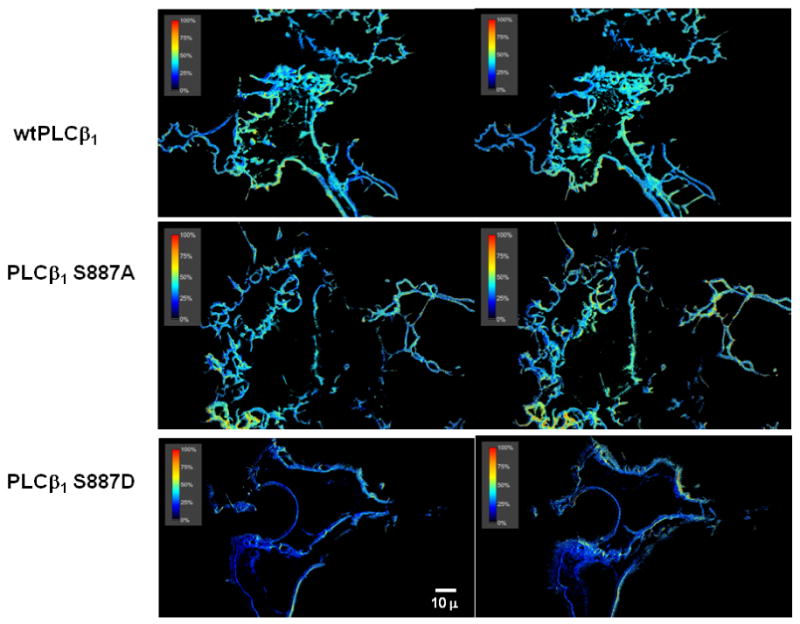
Figure 1.

Representative images showing the FRET between eCFP-Gαq and eYFP-PLCβ1 enzymes in transiently transfected HEK293 cells. Note that FRET is only seen on the plasma membrane where Gαq is localized. The FRET averages for several cells are listed in the text. Shown are images for the wt (top) S887A (middle) and S887D (bottom) 0s (left panels) and 140s after (right panels) viewing.
