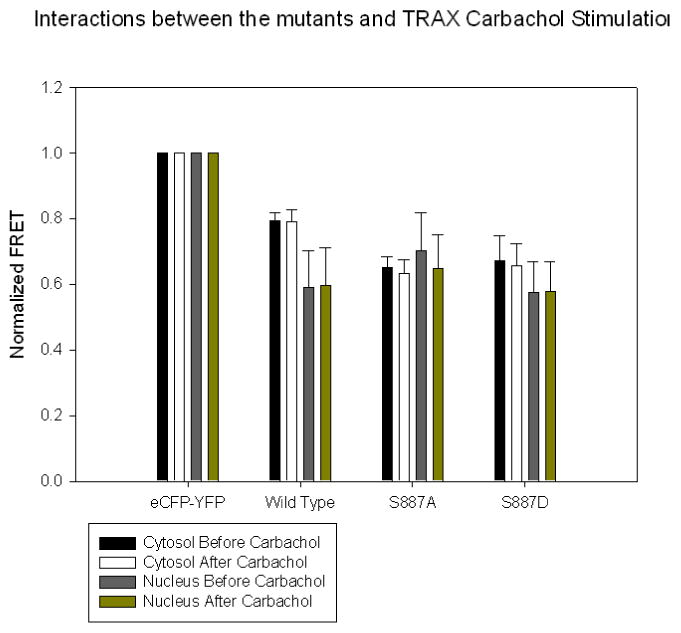
Figure 3.

A compilation of FRET values comparing the association between eCFP-TRAX and eYFP-PLCβ1 enzymes in HEK293 cells under basal conditions and 5 minutes after stimulation with 1 μM carbachol where n=6 and SD is shown. FRET values were scaled to values determined for the positive control (eCFP-GLLAPALLGLLA-eYFP, 0.7) and the negative control (free eCFP and free eYFP, 0.15), respectively.
