Abstract
Human erythrocytes require a continual supply of glutamate to support glutathione synthesis, but are unable to transport this amino acid across their cell membrane. Consequently, erythrocytes rely on de novo glutamate biosynthesis from α-ketoglutarate and glutamine to maintain intracellular levels of glutamate. Erythrocytic glutamate biosynthesis is catalyzed by three enzymes, alanine aminotransferase (ALT), aspartate aminotransferase (AST), and glutamine aminohydrolase (GA). Although the presence of these enzymes in RBCs has been well documented, the relative contributions of each pathway have not been established. Understanding the relative contributions of each biosynthetic pathway is critical for designing effective therapies for sickle cell disease, hemolytic anemia, pulmonary hypertension, and other glutathione-related disorders. In this study, we use multidimensional 1H–13C nuclear magnetic resonance (NMR) spectroscopy and multiple reaction mode mass spectrometry (MRM-MS) to measure the kinetics of de novo glutamate biosynthesis via AST, ALT, and GA in intact cells and RBC lysates. We show that up to 89% of the erythrocyte glutamate pool can be derived from ALT and that ALT-derived glutamate is subsequently used for glutathione synthesis.
Keywords: Metabolic flux analysis, Glutathione biosynthesis, Red blood cells
Introduction
Glutathione (GSH) plays a central role in repairing oxidative damage to red blood cells (RBCs). Alterations in glutathione levels have been linked to a variety of human disorders, including sickle cell disease, hemolytic anemia, and pulmonary hypertension (Wu et al. 2004). Although all of the enzymes required for synthesizing glutathione from its component amino acids (glutamate, cysteine, glycine) are present in erythrocytes (Majerus et al. 1971; Minnich et al. 1971), the RBC membrane is essentially impermeable to glutamate (Sass 1968; Winter and Christensen 1964; Young et al. 1987). Consequently, RBCs rely on de novo glutamate biosynthesis to maintain intracellular levels of this amino acid.
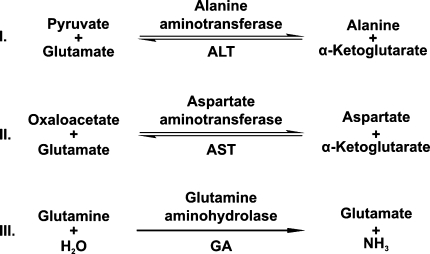
RBCs contain three enzymes for synthesizing glutamate: alanine aminotransferase (ALT; EC 2.6.1.2), aspartate aminotransferase (AST; EC 2.6.1.1), and glutamine aminohydrolase (GA; EC 3.5.1.2). ALT and AST synthesize glutamate from α-ketoglutarate whereas GA synthesizes glutamate from glutamine (Fig. 1). Since RBC membranes are permeable to both α-ketoglutarate and glutamine (Griffith 1981; Sass 1968; Young et al. 1983), all three mechanisms can potentially influence intracellular glutamate levels. However, GA is generally thought to be the main contributor to RBC glutamate biosynthesis (Griffith 1981; Ellory et al. 1983; Niihara et al. 1997; Morris et al. 2008).
Fig. 1.
Reaction mechanisms for (I) alanine aminotransferase (ALT) and (II) aspartate aminotransferase (AST). Unlike glutamate, both alanine and α-ketoglutarate cross the RBC membrane; ALT and AST provide a mechanism for de novo glutamate production that could support glutathione biosynthesis
We recently reported that roughly one percent of the glucose consumed by RBCs incubated in an amino acid free medium is devoted to de novo alanine production (Lewis et al. 2009a, b). Since ALT is the only enzyme for synthesizing alanine in RBCs, this result suggests that ALT activity can have a significant impact on steady-state glutamate levels. Given that ALT and AST reactions are readily reversible, and that the substrates for the ALT and AST reactions are normally present in the serum (Wishart et al. 2009), we reasoned that aminotransferase reactions may be playing a significant, and currently underappreciated, role in RBC glutamate biosynthesis in vivo.
Although most of the transport and enzymatic kinetics associated with RBC glutamate metabolism are known (Griffith 1981), the relative biosynthetic capacities of ALT, AST, and GA have not been directly evaluated in intact cells. Understanding the relative contribution of each pathway is important for designing effective therapies for diseases related to glutathione deficiencies. In this study, we apply modern metabolomics techniques to measure the biosynthetic capacities of AST, ALT, and GA in intact cells and hemolysates. Using multidimensional 1H–13C nuclear magnetic resonance (NMR) spectroscopy and multiple reaction mode mass spectrometry (MRM-MS) we show that ALT can contribute up to 89% of the intracellular glutamate pool and that ALT-derived glutamate is incorporated into glutathione. These data argue that aminotransferase reactions are more significant than GA in influencing steady-state levels of glutamate in vivo.
Methods
Preparation of RBCs and lysates
Fresh blood was collected by venipuncture from healthy human volunteers (n = 3) into heparinized vacutainers. RBCs were isolated by centrifugation (10 min at 3,000×g), and the buffy coat was discarded. Samples were washed three times in isotonic HEPES buffer (25 mM HEPES, 1 mM NaH2PO4, 106 mM NaCl, 19 mM KCl, 1 mM CaCl2, pH 7.4), combined into a single pool, and resuspended at 20% hematocrit in HEPES buffer containing 20 IU/mL Penicillin/Streptomycin (Gibco). Lysates were prepared from washed RBCs suspended at 36% hematocrit. RBCs were hemolyzed by sonication for 1 min and the resulting lysates were diluted to the equivalent of 25% hematocrit with isotonic HEPES buffer containing metabolite standards (see aminotransferase activity assays in RBC lysates). All sample preparations were conducted at 4°C to minimize metabolic activity.
Metabolic activity assays in intact RBCs
Washed RBCs were prepared in isotonic HEPES buffer containing either (i) 5 mM [U–13C]-glucose (Isotec), (ii) 5 mM glucose, 5 mM alanine, and 5 mM [13C1,2,3,4]-α-ketoglutarate (Cambridge Isotope Laboratories) or (iii) 5 mM glucose and 1 mM [U13C–15N] glutamine. Each RBC suspension was split into three replicate samples, which were incubated at 37°C over periods of (i, iii) 12 h or (ii) 21 h. Aliquots (1 mL) were collected from samples after incubation times of 0, 1.5, 3, 6, 12, and 21 h (only ii) and flash frozen in liquid nitrogen. Metabolites were then extracted from each sample (as described below) and analyzed by NMR spectroscopy and MS for the presence of isotopically enriched molecules. Enriched metabolites were identified and quantified by NMR, and the isotopic enrichments were determined by MS. Samples containing [U–13C]-glucose (i) provided information about glycolytically-related metabolism; samples containing [13C1,2,3,4]-α-ketoglutarate (ii) provided information on aminotransferase reactions; and samples containing [U13C–15N] glutamine (iii) provided information on glutamine aminohydrolase activity.
Aminotransferase activity assays in RBC lysates
RBC lysates were incubated at 37°C for 6–12 h in isotonic HEPES buffer containing 200 μM pyridoxal-5′-phosphate (PLP; the cofactor required by aminotransferases) and one of the following pairs of substrates (5 mM each): pyruvate + glutamate for alanine aminotransferase (ALT) assays, alanine + α-ketoglutarate for reverse ALT assays, oxaloacetate + glutamate for aspartate aminotransferase (AST) assays, aspartate + α-ketoglutarate for reverse AST assays, and pyruvate plus one of each of the amino acids listed in Fig. 3 for aminotransferase screening assays. Aliquots (900 μL) of each sample were collected after 0, 1, 3, 6 and 12 h of incubation and flash frozen in liquid nitrogen. Metabolites were then extracted (as described below) and analyzed by NMR.
Fig. 3.
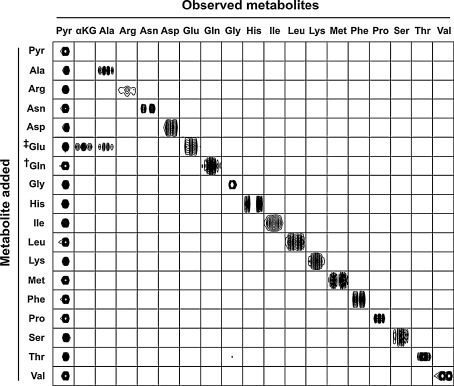
Aminotransferase screening assay used to determine the alanine biosynthetic route in human RBCs. Cell lysates were incubated with 200 μM pyridoxal-5′-phosphate, 5 mM pyruvate, and 5 mM of a target amino acid. Each square shows the unique 1H–13C NMR sub-spectrum used to identify and quantify each metabolite observed in the RBC lysates. Row labels denote the compounds added to samples, and column labels denote metabolite signals observed by 1H–13C NMR. In the first row, no amino acid was added in addition to pyruvate; in subsequent rows, the indicated amino acid was added in addition to pyruvate. Abbreviations: Pyr pyruvate, αKG α-ketoglutarate, amino acids are represented by standard three letter code. ‡The samples prepared with glutamate showed signals from both the substrate (glutamate) and the two products (alanine and α-ketoglutarate). †Samples incubated with glutamine showed no detectable levels of GA activity. However, GA activity was detectable by MS
Metabolite extraction
Samples were placed in a boiling water bath for 7.5 min to lyse cells and halt enzymatic activity. Boiled lysates were spun at 16,000×g to pellet cellular debris. For samples to be analyzed by LC–MS/MRM, a 200 μL aliquot of each supernatant was transferred to a fresh tube and stored at −80°C until analysis. For samples to be analyzed by NMR, an 800 μL aliquot of each supernatant was dried in a SpeedVac Concentrator (Thermo Scientific), and the resulting residue was dissolved in 800 μL D2O containing 500 μM NaN3 and 500 μM 4,4-dimethyl-4-silapentane-1-sulfonic acid (DSS).
NMR spectroscopy
NMR data were collected at the National Magnetic Resonance Facility at Madison. Two-dimensional sensitivity enhanced 1H–13C HSQC spectra were collected on a Varian 600 MHz spectrometer equipped with a cryogenic probe. Spectra were collected, following 16 transients to achieve steady state, as four averaged transients with 128 increments in the second dimension (50 increments for the in vivo labeling studies). The acquisition time was 300 ms (3,000 data points), following an initial delay of 1 s; the carbon spectral width was 70 ppm. Time-domain data were Fourier transformed with a shifted exponential sine-bell window function, phased, and chemical shift referenced to DSS using custom nmrDraw (Delaglio et al. 1995) scripts written in-house.
Our methods for identifying and quantifying metabolites by 1H–13C NMR have been described elsewhere (Lewis et al. 2009a, b; Lewis et al. 2007). Briefly, metabolites were identified using the Madison Metabolomics Consortium Database (MMCD) (Cui et al. 2008); assignments were verified by overlaying NMR spectra of standards from the BioMagResBank (BMRB) (Markley et al. 2007); metabolite concentrations were calculated from peak intensities on the basis of calibration curves from metabolite standards prepared at 2, 5, and 10 mM. The rNMR software package (Lewis et al. 2009a, b) was used in performing all NMR data analyses.
Mass spectrometry
Mass spectra were collected at the University of Wisconsin Biotechnology Center Mass Spectrometry Facility. An aliquot (5 μL) of each metabolite extract was analyzed by liquid chromatography (LC) MS on an Applied Biosystems 3200 Q TRAP LC–MS/MS system equipped with an Agilent 1100 series capillary LC pump and an electrospray ionization (ESI) source. Online LC used a 4.6× 150 mm Phenomenex Luna hydrophylic interaction chromatography (HILIC) column (200-Å pore size, 5-μm particle size) with a constant flow rate of 200 μL/min. Samples were eluted over a 48-min ammonium formate (50 mM, pH 5.4; buffer A) to acetonitrile gradient. The elution gradient was constructed as follows: 90% A at time zero, 70% A at 20 min, holding at 70% A for 2 min, 10% A at 22 min, holding at 10% A for 1 min, back to 90% A at 23 min, and isocratic at 90% A until 48 min. ESI–MS was performed in positive ion multiple reaction mode (MRM). Peak picking and integration were accomplished with Analyst software (Applied Biosystems). Metabolite identification, retention times, and ion fragment patterns, were verified by reference to standard compounds. The Kombyonyx isotope calculator (www.kombyonyx.com) was used to calculate isotopomer distributions.
Regression analyses and statistics
Rates of metabolite consumption and production were calculated by linear regression of metabolite concentration as a function of time. Regression analyses were based on all time points, except for samples incubated with aspartate + α-ketoglutarate and oxaloacetate + glutamate. Kinetics observed in the latter samples were nonlinear because of spontaneous decarboxylation of oxaloacetate to pyruvate (Hatch and Heldt 1985). For these samples, initial rates were determined from the time points between 0 and 1 h. Samples incubated with [13C1,2,3,4] α-ketoglutarate contained contaminating [13C1,2,3,4] glutamate, which was determined from the 0 h time points and used as a baseline for subsequent measurements. Glutamate kinetics from cells incubated with [13C1,2,3,4] α-ketoglutarate were derived from linear regression of the first three time points. All of the p values presented here were derived from a two-tailed equal variance t-test.
Results
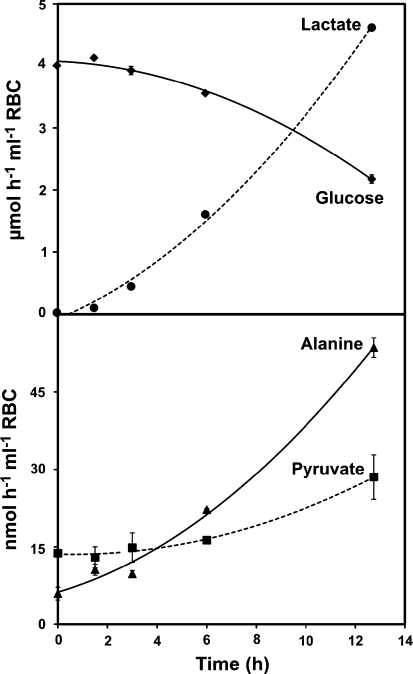
Reports of de novo alanine synthesis by intact RBCs (Lewis et al. 2009a, b; Manuel y Keenoy et al. 1991) suggest an active role for aminotransferases in maintaining intracellular glutamate levels. We confirmed these reports by incubating RBCs in 5 mM [U–13C] glucose and measuring the appearance of 13C enriched alanine by 1H–13C NMR (Fig. 2). The rate of 13C alanine production we observed (0.022 ± 0.001 μmol mL−1 RBC h−1) is consistent with our previous findings and accounted for 1.1% of the total 13C output (Table 1). LC–ESI–MS analyses indicated that 35% of the total alanine pool was uniformly 13C labeled after 12 h of incubation with [U–13C] glucose, whereas samples harvested at 0 h showed natural abundance 13C levels (Table 2).
Fig. 2.
Glucose, lactate, alanine, and pyruvate metabolism observed in human RBCs. Samples were incubated with 5 mM [U–13C] glucose and metabolites were quantified by 1H–13C NMR. Error bars represent S.E.M. (n = 3)
Table 1.
Rates of glucose, lactate, alanine, pyruvate and glutamate metabolism observed in intact RBCs
| Metabolite(s) added | Observed rates of biosynthesis from the labeled substrate (μmol mL−1 RBC h−1)a | |||||
|---|---|---|---|---|---|---|
| Glucose | Lactate | Alanine | Pyruvate | Glutamate | α-Ketoglutarate | |
| [U–13C6] glucose | −0.78 ± 0.03 | 1.89 ± 0.01 | 0.02 ± 0.001 | 0.01 ± 0.002 | n.o.b | n.o.b |
| [13C1,2,3,4] α-ketoglutarate, glucose, alanine | −0.80 ± 0.01c | 1.35 ± 0.02c | −0.11 ± 0.07c | 0.57 ± 0.04c | 0.17 ± 0.01c | −0.16 ± 0.06c |
| [U13C-15N] glutamine, glucose | −0.91 ± 0.03 | 2.13 ± 0.04 | n.o.b | n.o.b | 0.004 ± 0.001 | n.o.b |
aMeans and S.E.M. for n = 3
bn.o. = not observed
c21 h time point was excluded in the rate calculation
Table 2.
Isotopomer distribution of alanine in RBCs incubated with [U–13C] glucose
| Time (h) | Percent mass isotopomer distribution (alanine)a | ||||
|---|---|---|---|---|---|
| Monoisotopic | M + 1 | M + 2 | M + 3 | M + 4 | |
| 0 | 95.6 ± 0.4 | 2.43 ± 0.63 | n.d.b | 1.94 ± 0.51 | 0 |
| 12 | 60.6 ± 1.1** | 4.04 ± 0.04* | n.d.b | 35.4 ± 1.1** | 0 |
| Expected distribution due to natural abundance | 95.92 | 3.62 | 0.44 | 0.01 | 0 |
aMeans and S.E.M. for n = 3
bn.d. = not determined
* p < 0.05; ** p < 0.001
Aminotransferase activity in RBC lysates
To screen for alanine synthesis reactions, we incubated RBC lysates for 6 h in HEPES buffered saline containing 5 mM pyruvate, 200 μM pyridoxal-5′-phosphate (PLP), and 5 mM target amino acid. 1H–13C NMR analysis of the lysates showed significant alanine and α-ketoglutarate production in the sample incubated with glutamate as the target amino acid (Fig. 3).
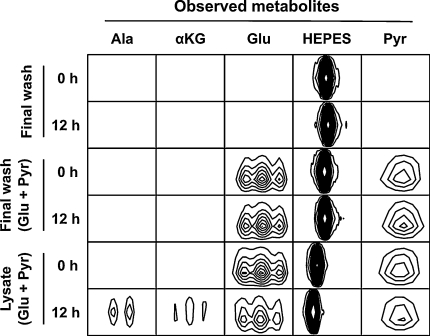
Conversion of glutamate + pyruvate to α-ketoglutarate + alanine in the presence of PLP is consistent with the established alanine aminotransferase (ALT) reaction mechanism (Fig. 1) and is indicative of aminotransferase activity in the lysates. However, ALT is present in serum, and contaminating enzyme from the wash medium could influence our results. To control for contaminating ALT, both serum and the final RBC wash buffer were assayed for ALT activity using the method we applied to the RBC lysates. Although ALT activity was observed in serum samples (2.82 ± 0.32 μmol alanine produced over 12 h), the final RBC wash buffer showed no detectable ALT activity (Fig. 4). These findings demonstrate that our assay is sufficiently sensitive to detect serum levels of ALT and that the ALT activity observed in RBC lysates did not result from extracellular ALT.
Fig. 4.
Metabolic activity of final wash buffer used for RBC preparation. 1H–13C NMR signals indicating no detectable aminotransferase activity after 12 h of incubation. Abbreviations: αKG α-ketoglutarate, Pyr pyruvate; amino acids are represented by their three letter codes
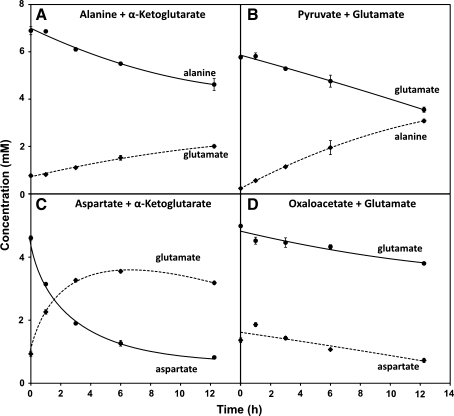
Glutamate biosynthesis via aminotransferase reactions can be limited by either transport or reaction kinetics. To determine the maximum enzymatic rates of the AST and ALT reactions under physiologically-relevant conditions with naturally-occurring levels of enzymes, we incubated RBC lysates for 12 h with 200 μM PLP and saturating levels of substrates for the two aminotransferases (Fig. 1). We determined both the forward and reverse reaction rates for each aminotransferase. 1H–13C NMR analysis of the lysates showed efficient conversion of α-ketoglutarate to glutamate in the presence of either aspartate or alanine (5.32 ± 0.45 and 0.42 ± 0.03 μmol mL−1 lysate h−1, respectively), indicating that RBCs have a high enzymatic capacity for both AST and ALT reactions. Similarly, glutamate was efficiently converted to α-ketoglutarate in the presence of either pyruvate or oxaloacetate (Fig. 5). As expected, rate constants observed for the forward and reverse reactions were comparable (Table 3).
Fig. 5.
Aminotransferase reactions catalyzed by (a, b) alanine aminotransferase and (c, d) aspartate aminotransferase observed in human RBC lysates. Samples were incubated with 5 mM of each substrate and analyzed by 1H–13C NMR. The title of each plot indicates which substrates were added. Error bars represent S.E.M. (n = 3)
Table 3.
Rates of ALT and AST aminotransferase reactions observed in RBC lysates
| Metabolites added | Observed rates (μmol mL−1 lysate h−1)a | ||||
|---|---|---|---|---|---|
| Alanine | α-Ketoglutarate | Aspartate | Glutamate | Pyruvate | |
| alanine + α-ketoglutarated | −0.78 ± 0.11 | −0.77 ± 0.08 | n.o.b | 0.42 ± 0.03 | 0.46 ± 0.03 |
| glutamate + pyruvated | 0.94 ± 0.03 | 0.57 ± 0.01 | n.o.b | −0.76 ± 0.04 | −0.46 ± 0.06 |
| aspartate + α-ketoglutaratee | 0.49 ± 0.17 | −3.23 ± 0.75c | −5.85 ± 0.30c | 5.32 ± 0.45c | 0.73 ± 0.05 |
| glutamate + oxaloacetatee | −0.73 ± 0.05 | 2.13 ± 0.54c | 1.98 ± 0.53c | −1.87 ± 0.28c | −0.18 ± 0.04 |
aMeans and S.E.M. for n = 3
bn.o. = not observed
cRate was calculated using the first two time points
dALT pathway
eAST pathway
Interpretation of the AST reaction is complicated by the rapid spontaneous degradation of oxaloacetate to pyruvate (Hatch and Heldt 1985). RBC lysates incubated with aspartate + α-ketoglutarate showed rates of alanine production comparable to samples incubated with pyruvate + glutamate (Table 3). This non-intuitive result is caused by a three-part coupled reaction involving conversion of aspartate to oxaloacetate via AST, spontaneous degradation of oxaloacetate to pyruvate (Hatch and Heldt 1985), and the subsequent conversion of pyruvate to alanine via ALT.
Glutamate and glutathione synthesis in intact RBCs
GA is generally considered to be the main glutamate biosynthesis pathway in RBCs (Griffith 1981; Ellory et al. 1983; Niihara et al. 1997; Morris et al. 2008), but the high levels of ALT and AST activity we observed in RBC lysates suggest that aminotransferases can have a significant impact on steady-state glutamate levels. However, the extent to which aminotransferases contribute to glutamate biosynthesis in intact cells is limited by the transport rates for the various substrates. Aspartate transport previously has been shown to be low (5 μM h−1) (Fincham et al. 1987; Maede et al. 1983), and thus is a limiting factor in AST-derived glutamate production. However, the substrates of the GA and ALT reactions previously were shown to be efficiently transported at similar rates (108 and 256 μM h−1, for glutamine and alanine respectively) (Niihara et al. 1997), which argues that both GA and ALT reactions contribute to the glutamate pool. To determine the relative contributions of ALT and GA to the total glutamate pool of intact cells, we incubated RBCs with 13C labeled precursors of the ALT and GA reactions and measured the appearance of 13C in glutamate and glutathione by 1H–13C NMR and LC–MS/MRM.
Rates of ALT-derived glutamate were derived from RBCs incubated for 21 h with glucose, alanine, and [13C1,2,3,4] α-ketoglutarate (5 mM each). Intact RBCs produced 13C-enriched glutamate at an average rate of 0.17 μmol mL−1 RBC h−1 and consumed alanine at a rate of 0.11 μmol mL−1 RBC h−1 (Table 1). MS analysis showed that 89% (p < 0.001 relative to natural abundance) of the RBC glutamate pool was [13C1,2,3,4] labeled after 21 h (Table 4), indicating active de novo glutamate synthesis by intact cells. Although ALT-derived glutathione biosynthetic rates were below the NMR detection limit, MS analysis showed significant (p < 0.05 relative to natural abundance) 13C1,2,3,4 isotopic enrichment in the glutamate moiety of glutathione at the 21 h time point and time-dependent enrichment of glutathione over the course of the experiment (Table 5). Rates of GA-derived glutamate production were derived from RBCs incubated in glucose (5 mM) and [U13C-15N] glutamine (1 mM). GA-derived glutamate was produced at a rate 30 times lower (0.0039 ± 0.00065 μmol mL−1 RBC h−1) than rates observed for ALT-derived glutamate (Table 1).
Table 4.
Isotopomer distribution of glutamate in RBCs incubated with [13C1,2,3,4] α-ketoglutarate, alanine, and glucose
| Time (h) | Percent Mass isotopomer distribution (glutamate)a | ||||
|---|---|---|---|---|---|
| Monoisotopic | M + 1 | M + 2 | M + 3 | M + 4 | |
| 0 | 95.3 ± 1.7 | 4.66 ± 1.66 | 0 | 0 | 0 |
| 6 | 15.9 ± 0.7** | 0.72 ± 0.08** | 0.10 ± 0.10 | 2.52 ± 0.37* | 80.8 ± 0.3** |
| 12 | 10.4 ± 0.7** | 0.41 ± 0.01** | 0 | 3.08 ± 0.55* | 86.1 ± 0.9** |
| 21.25 | 7.47 ± 0.24** | 0.24 ± 0.01** | 0 | 2.82 ± 0.14* | 89.4 ± 0.3** |
| Expected distribution due to natural abundance | 93.40 | 5.64 | 0.91 | 0.05 | 0.00 |
aMeans and S.E.M. for n = 3
* p < 0.05; ** p < 0.001
Table 5.
Isotopomer distribution of GSH in RBCs incubated with [13C1,2,3,4] α-ketoglutarate, alanine, and glucose
| Time (h) | Percent Mass isotopomer distribution (GSH)a | ||||
|---|---|---|---|---|---|
| Monoisotopic | M + 1 | M + 2 | M + 3 | M + 4 | |
| 0 | 85.6 ± 2.5 | 11.4 ± 2.9 | 1.47 ± 0.86* | 1.59 ± 0.81 | 0 |
| 6 | 86.6 ± 1.1 | 7.99 ± 0.19* | 1.67 ± 0.45* | 0.33 ± 0.33 | 3.42 ± 0.33** |
| 12 | 80.9 ± 0.8 | 8.08 ± 0.60 | 2.11 ± 0.34* | 0.80 ± 0.42 | 8.09 ± 0.15** |
| 21.25 | 78.4 ± 0.9* | 7.96 ± 0.67 | 1.03 ± 0.52* | 1.38 ± 0.18* | 11.3 ± 1.2* |
| Expected distribution due to natural abundance | 82.93 | 10.90 | 5.43 | 0.62 | 0.10 |
aMeans and S.E.M. for n = 3
* p < 0.05; ** p < 0.001
Discussion
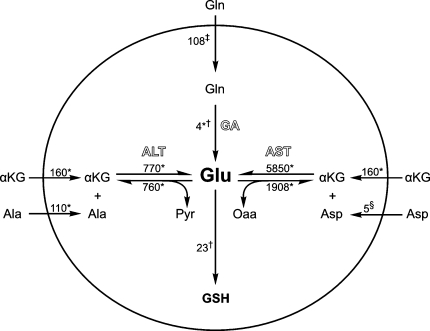
Human erythrocytes require a continual supply of glutamate to support glutathione synthesis, but are unable to transport this amino acid across their cell membrane (Sass 1968; Winter and Christensen 1964; Young et al. 1987). Although glutamine aminohydrolase is often cited as the main contributor to intracellular glutamate levels (Ellory et al. 1983; Griffith 1981; Morris et al. 2008; Niihara et al. 1997), rates of glutathione biosynthesis are considerably higher than the maximum capacity of GA to produce glutamate. Even by conservative estimates (Griffith 1981), demand from glutathione biosynthesis is nearly 8 times higher than the rates of GA-derived glutamate production observed in this study (Fig. 6). The discrepancy between glutamate demand and GA’s biosynthetic capacity argues that GA is a minor contributor to the glutamate pool.
Fig. 6.
Three pathways for de novo glutamate synthesis in RBCs. Rates (μM h−1) indicate NMR, MS and literature values for transport kinetics, alanine aminotransferase, aspartate aminotransferase, glutamine aminohydrolase, and glutathione biosynthesis. Abbreviations: Pyr pyruvate, αKG α-ketoglutarate, Oaa oxaloacetate, amino acids are represented by their three letter codes. *Data from the current study; †data from (Griffith 1981); ‡data from (Niihara et al. 1997); §data from (Fincham et al. 1987; Maede et al. 1983). Because of rapid kinetics of the aminotransferase reactions, alanine and α-ketoglutarate transport rates were assumed to be equivalent to the overall rates at which intact cells consumed these compounds
In contrast to our GA findings, we found that up to 89% of the intracellular glutamate pool of intact cells can be attributed to alanine aminotransferase. ALT activity observed in this study exceeded GA activity by 30 fold and was considerably greater than demand from glutathione synthesis. As expected, ALT-derived glutamate is ultimately incorporated into glutathione. These findings clearly demonstrate that ALT can be a major contributor to steady-state glutamate levels of intact RBCs and argue that in vivo glutamate synthesis is predominantly attributable to ALT.
The biological significance of the high aspartate aminotransferase activity we observed in this study is unclear. Although RBC membranes are essentially impermeable to aspartate (Fincham et al. 1987; Maede et al. 1983), the intracellular machinery for converting aspartate to glutamate is nearly 13 times more efficient than ALT. Since mature erythrocytes lack the enzymes required for oxaloacetate synthesis, the presence of AST cannot be attributed to aspartate biosynthesis. One possible explanation for the presence of AST is that the enzyme is a developmental holdover from reticulocytes, which synthesize oxaloacetate as a part of the tricarboxylic acid cycle (Gasko and Danon 1972).
In summary, we evaluated three possible pathways for glutamate production in RBCs using 1H–13C NMR and MS metabolomics techniques. Of these pathways, only ALT provides a plausible mechanism for supporting glutathione synthesis in intact cells. Given that human RBCs are readily permeable to cysteine and glycine (Harvey and Ellory 1989), and that all of the glutathione biosynthetic steps are well characterized (Majerus et al. 1971; Minnich et al. 1971), the ALT mechanism presented here provides a simple explanation for the sole unresolved step in glutathione biosynthesis.
Acknowledgments
We thank Dr. Philip S. Low and M. Estela Campanella (Purdue University) for collecting the blood used in this study. This work was supported by NIH grant P41 RR02301; I.A.L. was the recipient of a fellowship from the NHGRI 1T32HG002760; NMR data were collected at the National Magnetic Resonance Facility at Madison (NMRFAM) funded by NIH grants (P41 RR02301 and P41 GM GM66326).
Open Access
This article is distributed under the terms of the Creative Commons Attribution Noncommercial License which permits any noncommercial use, distribution, and reproduction in any medium, provided the original author(s) and source are credited.
References
- Cui Q, Lewis IA, Hegeman AD, Anderson ME, Li J, Schulte CF, Westler WM, Eghbalnia HR, Sussman MR, Markley JL. Metabolite identification via the Madison Metabolomics Consortium Database. Nat Biotechnol. 2008;26:162–164. doi: 10.1038/nbt0208-162. [DOI] [PubMed] [Google Scholar]
- Delaglio F, Grzesiek S, Vuister GW, Zhu G, Pfeifer J, Bax A. NMRPIPE—A multidimensional spectral processing system based on UNIX pipes. J Biomol NMR. 1995;6:277–293. doi: 10.1007/BF00197809. [DOI] [PubMed] [Google Scholar]
- Ellory JC, Preston RL, Osotimehin B, Young JD. Transport of amino acids for glutathione biosynthesis in human and dog red cells. Biomed Biochim Acta. 1983;42:S48–S52. [PubMed] [Google Scholar]
- Fincham DA, Mason DK, Paterson JY, Young JD. Heterogeneity of amino acid transport in horse erythrocytes: a detailed kinetic analysis of inherited transport variation. J Physiol. 1987;389:385–409. doi: 10.1113/jphysiol.1987.sp016662. [DOI] [PMC free article] [PubMed] [Google Scholar]
- Gasko O, Danon D. The metabolism of maturing reticulocytes. I. The existence of a functional tricarboxylic acid cycle. Br J Haematol. 1972;23:525–533. doi: 10.1111/j.1365-2141.1972.tb07088.x. [DOI] [PubMed] [Google Scholar]
- Griffith OW. Glutathione turnover in human erythrocytes. Inhibition by buthionine sulfoximine and incorporation of glycine by exchange. J Biol Chem. 1981;256:4900–4904. [PubMed] [Google Scholar]
- Harvey CM, Ellory JC. Identification of amino acid transporters in the red blood cell. Methods Enzymol. 1989;173:122–160. doi: 10.1016/S0076-6879(89)73010-X. [DOI] [PubMed] [Google Scholar]
- Hatch MD, Heldt HW. Synthesis, storage, and stability of [4–14C]oxaloacetic acid. Anal Biochem. 1985;145:393–397. doi: 10.1016/0003-2697(85)90379-3. [DOI] [PubMed] [Google Scholar]
- Lewis IA, Schommer SC, Hodis B, Robb KA, Tonelli M, Westler WM, Sussman MR, Markley JL. Method for determining molar concentrations of metabolites in complex solutions from two-dimensional 1H–13C NMR spectra. Anal Chem. 2007;79:9385–9390. doi: 10.1021/ac071583z. [DOI] [PMC free article] [PubMed] [Google Scholar]
- Lewis IA, Campanella ME, Markley JL, Low PS. Role of band 3 in regulating metabolic flux of red blood cells. Proc Natl Acad Sci USA. 2009;106:18515–18520. doi: 10.1073/pnas.0905999106. [DOI] [PMC free article] [PubMed] [Google Scholar]
- Lewis IA, Schommer SC, Markley JL. rNMR: open source software for identifying and quantifying metabolites in NMR spectra. Magn Reson Chem. 2009;47:s123–s126. doi: 10.1002/mrc.2526. [DOI] [PMC free article] [PubMed] [Google Scholar]
- Maede Y, Inaba M, Taniguchi N. Increase of Na-K-ATPase activity, glutamate, and aspartate uptake in dog erythrocytes associated with hereditary high accumulation of GSH, glutamate, glutamine, and aspartate. Blood. 1983;61:493–499. [PubMed] [Google Scholar]
- Majerus PW, Brauner MJ, Smith MB, Minnich V. Glutathione synthesis in human erythrocytes. II. Purification and properties of the enzymes of glutathione biosynthesis. J Clin Invest. 1971;50:1637–1643. doi: 10.1172/JCI106652. [DOI] [PMC free article] [PubMed] [Google Scholar]
- Manuel y Keenoy B, Conget I, Liemans V, Malaisse-Lagae F, Sener A, Malaisse WJ. Generation of 3HOH from D-[6–3H]glucose by erythrocytes: role of pyruvate alanine interconversion. Biochem Med Metab Biol. 1991;46:59–74. doi: 10.1016/0885-4505(91)90051-L. [DOI] [PubMed] [Google Scholar]
- Markley JL, Anderson ME, Cui Q, Eghbalnia HR, Lewis IA, Hegeman AD, Li J, Schulte CF, Sussman MR, Westler WM, Ulrich EL, Zolnai Z (2007) New bioinformatics resources for metabolomics. Pac Symp Biocomput:157–168 [PubMed]
- Minnich V, Smith MB, Brauner MJ, Majerus PW. Glutathione biosynthesis in human erythrocytes. I. Identification of the enzymes of glutathione synthesis in hemolysates. J Clin Invest. 1971;50:507–513. doi: 10.1172/JCI106519. [DOI] [PMC free article] [PubMed] [Google Scholar]
- Morris CR, Suh JH, Hagar W, Larkin S, Bland DA, Steinberg MH, Vichinsky EP, Shigenaga M, Ames B, Kuypers FA, Klings ES. Erythrocyte glutamine depletion, altered redox environment, and pulmonary hypertension in sickle cell disease. Blood. 2008;111:402–410. doi: 10.1182/blood-2007-04-081703. [DOI] [PMC free article] [PubMed] [Google Scholar]
- Niihara Y, Zerez CR, Akiyama DS, Tanaka KR. Increased red cell glutamine availability in sickle cell anemia: demonstration of increased active transport, affinity, and increased glutamate level in intact red cells. J Lab Clin Med. 1997;130:83–90. doi: 10.1016/S0022-2143(97)90062-7. [DOI] [PubMed] [Google Scholar]
- Sass MD. Glutathione synthesis in cell-free preparations from erythrocytes of different ages. Clin Chim Acta. 1968;22:207–210. doi: 10.1016/0009-8981(68)90359-8. [DOI] [PubMed] [Google Scholar]
- Winter CG, Christensen HN. Migration of amino acids across the membrane of the human erythrocyte. J Biol Chem. 1964;239:872–878. [PubMed] [Google Scholar]
- Wishart DS, Knox C, Guo AC, et al (2009) HMDB: a knowledgebase for the human metabolome. Nucleic Acids Res. 37(Database issue) D603–D610 [DOI] [PMC free article] [PubMed]
- Wu G, Fang YZ, Yang S, Lupton JR, Turner ND. Glutathione metabolism and its implications for health. J Nutr. 2004;134:489–492. doi: 10.1093/jn/134.3.489. [DOI] [PubMed] [Google Scholar]
- Young JD, Wolowyk MW, Jones SM, Ellory JC. Red-cell amino acid transport. Evidence for the presence of system ASC in mature human red blood cells. Biochem J. 1983;216:349–357. doi: 10.1042/bj2160349. [DOI] [PMC free article] [PubMed] [Google Scholar]
- Young JD, Wolowyk MW, Fincham DA, Cheeseman CI, Rabenstein DL, Ellory JC. Conflicting evidence regarding the transport of alpha-glutamyl-dipeptides by human erythrocytes. Biochem J. 1987;242:309–311. doi: 10.1042/bj2420309. [DOI] [PMC free article] [PubMed] [Google Scholar]


