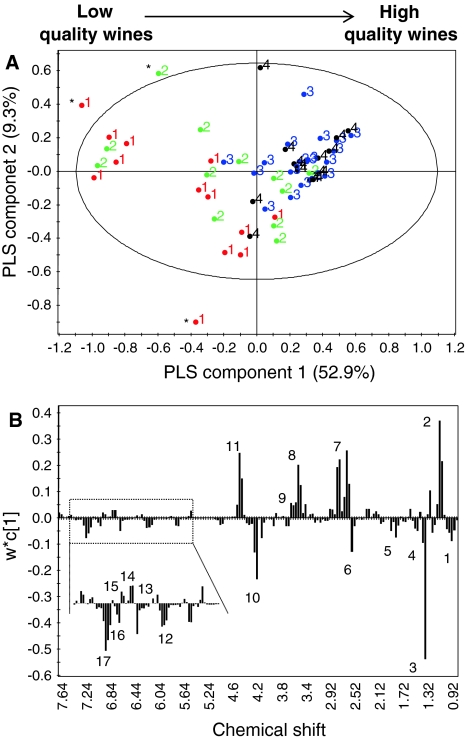
Fig. 3.
Partial least squares projections to latent structures (PLS) score (a) and loading line (b) plots. The score plot (a) shows arrangement of wine samples from low to high quality along component-1. Numbers (1–4) indicate the class to the wine sample belongs. Samples with ‘*’ are outliers. The column plot shows higher levels of compounds like 2: 2,3-butanediol, 7: malate, 8: proline, 9: arginine, 11: tartarate, 13, quercetin, 14: (+)-catechin, and 15: (−)-epicatechin, where as metabolites like 1: valine and leucine, 3: lactate, 4: alanine, 5: acetate, 6: succinate, 10: threonine, 12: caffeoyl moiety, 16: gallate, 17: vanillate, were found discriminating for low quality wines

