
Figure 3.
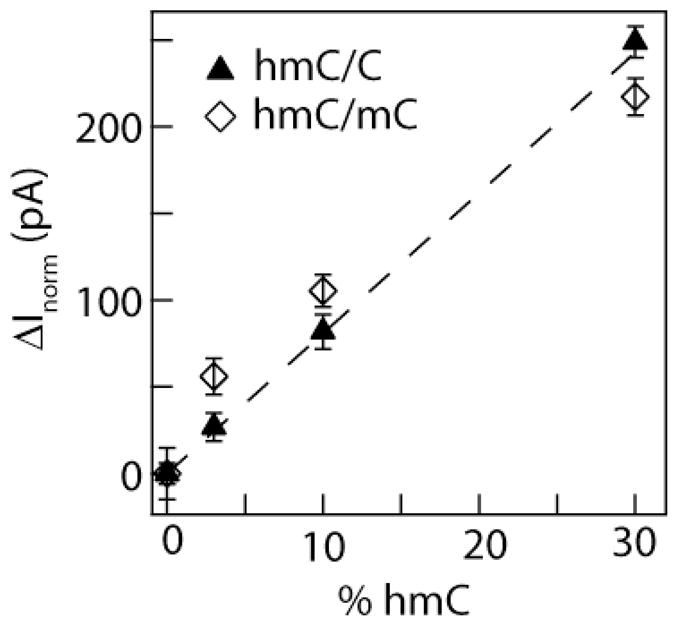
Normalized ΔImax values for 3 kbp DNA with mixed cytosines (ΔInorm). Different cytosine modification ratios hmC/C and hmC/mC were tested, and ΔImax values were found from Gaussian fits to the ΔI distributions. The values in the plots represent the difference in ΔImax values from 0% hmC samples. The dashed line is a best global regression fit to the data, with slope of 8 ± 0.5 pA per percent hmC. Our lowest confidence is distinguishing 0% hmC-DNA from 3% hmC-DNA is 91% according to a Student’s t-test (see SI-6). Each point is based on a measurement of 1,000–2,040 molecules, and the two datasets were obtained using different pores with a similar diameter.