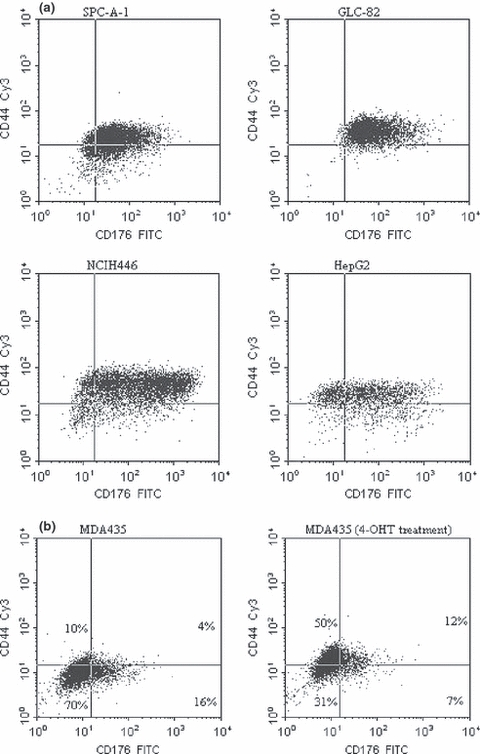
Figure 2.

(a) FACS analysis of co-expression of CD44 and CD176 in cells of the cell lines SPC-A-1, GLC-82 (lung adenocarcinoma) and HepG2 (hepatocellular carcinoma). Cells were incubated with anti-CD44 (IgG) and anti-CD176 (IgM) antibodies, followed by incubation with anti-IgG-Cy3 (γ-chain specific) and anti-IgM-fluorescein isothiocyanate (μ-chain specific) second antisera. A minimum of 10,000 events were collected per sample. The percentage of cells with the respective combination of markers is indicated in each section of the graph, demonstrating a strong correlation of staining of both markers. Data shown are representative of several independent experiments. (b) FACS analysis of co-expression of CD44 and CD176 before and after 4-OHT treatment of MDA-MB-435 (breast carcinoma) cells. The percentage of cells with the respective combination of markers is indicated in each section of the graph. The number of CD44+/CD176+ cells is increased after treatment with 4-OHT for 24 h. Data shown are representative of several independent experiments.
