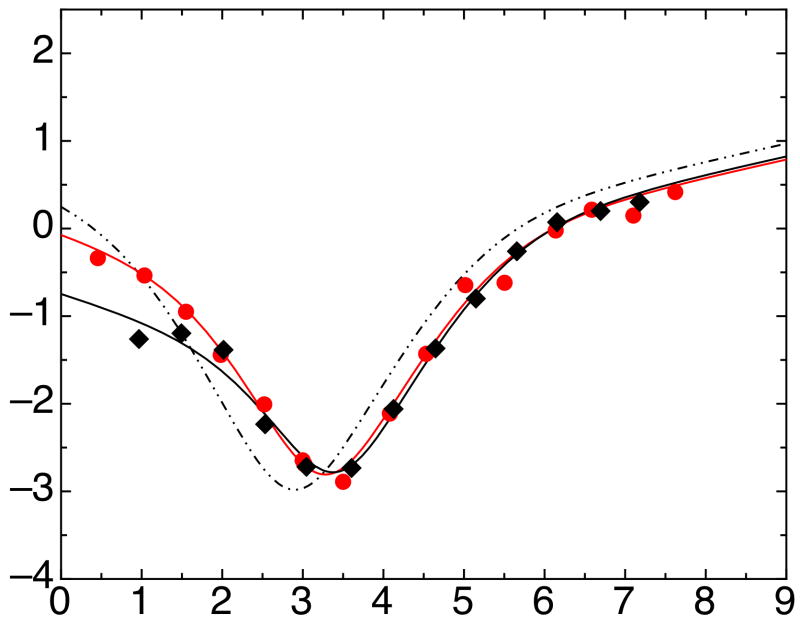
Figure 5.
Chevron plots for IκBα67-287 A133W/W258F (red circles) and A133W (black triangles) showing main unfolding and refolding rates at 5°C. Solid lines show global fits of all six-AR mutants to a four-state model with shared m-values (m12 = -0.15 kcal mol-1 M-1, m21 = 0.96 kcal mol-1 M-1, m32 = 0.87 kcal mol-1 M-1, m43 = 0.11 kcal mol-1 M-1; m23 and m34 were set to 0 kcal mol-1 M-1). For comparison, the fit of four-AR IκBα67-206W (main phase at 5°C) to four-state model is shown as a dashed line.

