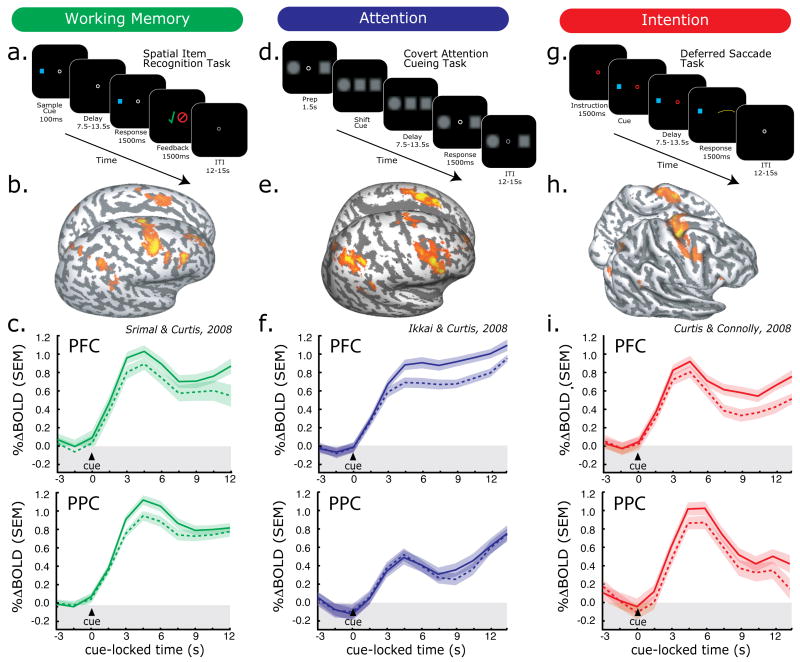
Fig 2.
Task and results summary from working memory (WM), attention, and intention studies. Trial schematics are shown for each task (a., d., and g.). Statistical parametric maps of significant delay period specific activity are projected onto the surface of a subject's cortical sheet for each task (b., e., and h.). Time courses (average, SEM) from the PFC (c., f., i. top panels) and PPC (bottom panels) are shown time locked to the presentation of the cue. Solid lines represent trials in which the memoranda (c.), locus of attention (f.), or direction of antisaccade (i.) was in hemifield contralateral to the cortical hemisphere and dashed lines represent ipsilateral trials. Notice that both PFC and PPC show delay period activation, that this activation persists throughout the delay period, and it shows a contralateral bias.

