Figure 3.

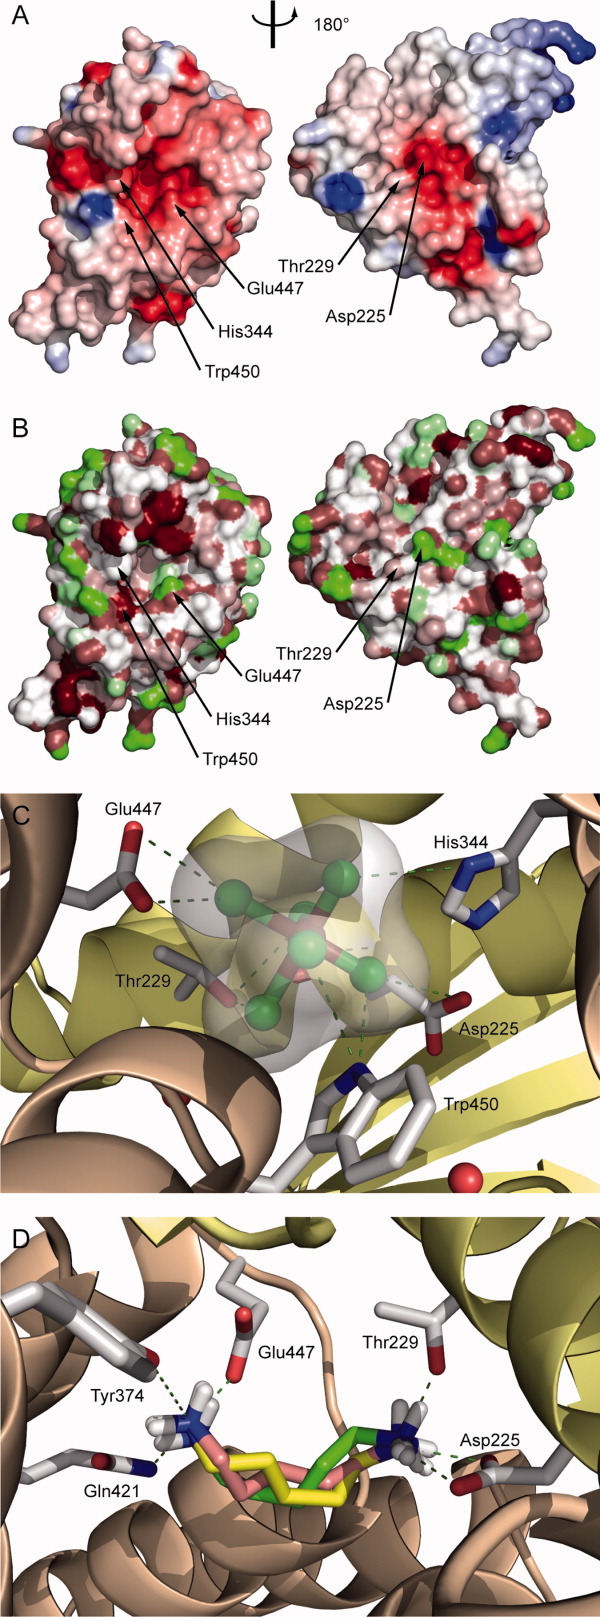
Analysis of the cavity and the interface between the two subdomains of CadCpd. (A) Electrostatic surface properties (cf. Fig. 1) of the C-terminal α-helical subdomain (residues 333–509; left) and the N-terminal predominantly β-sheet subdomain (residues 190–332; right). Both moieties were rotated by ±90° about a vertical axis to visualize the internal cavity surfaces. Residues that contact the bound ReCl62− ion are labeled. (B) Hydrophobic surface representation colored as in Figure 2B. (C) Complexation of ReCl62− within the central cavity. Interacting side chains of CadC within a distance of 4 Å to the rhenate central ion are indicated. (D) Results from a docking simulation with cadaverine. The three cadaverine conformations with highest scores as well as the putative interacting residues in the cavity are depicted as sticks. Cadaverine carbon atoms are colored differently according to scoring rank order: 1, yellow; 2, salmon; 3, green. Oxygen atoms are shown in red, nitrogen atoms are shown in blue, hydrogen atoms are shown in white, and hydrogen bonds are indicated as dark green dashed lines.
